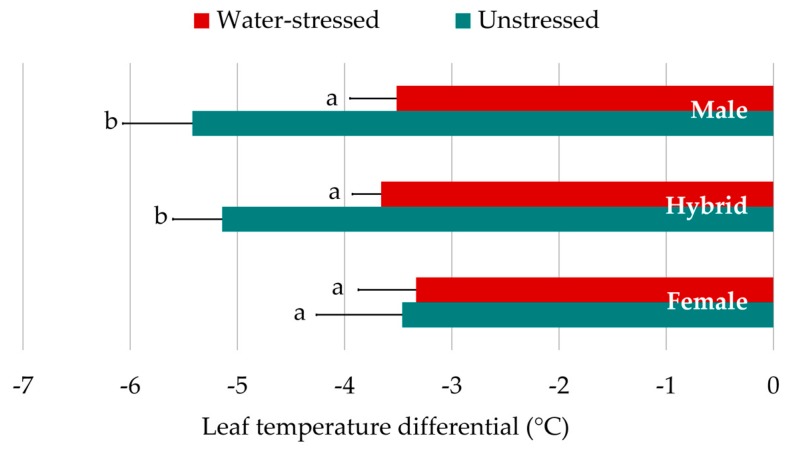
Figure 3.
Differences in leaf temperature differential response to water conditions between genotypic sets (all hybrids combined). Means ± 95% confidence interval of LTD in °C are represented for each genotypic class, under water-stressed and unstressed conditions. Bars with different letter are significantly different at P < 0.05 according to means separation by LSD.

