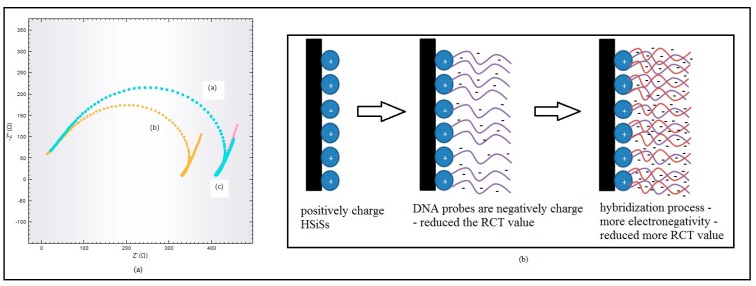
Figure 4.
(a) Nyquist plot for probe DNA (blue line), target DNA (yellow line), and non-complementary DNA (pink line) in Na-phosphate buffer 0.05 M containing 0.1 M NaCl at pH 7. (b) Proposed interaction between silica (positive charge) and DNA (negative charge) before and after the hybridization process on the electrode surfaces.

