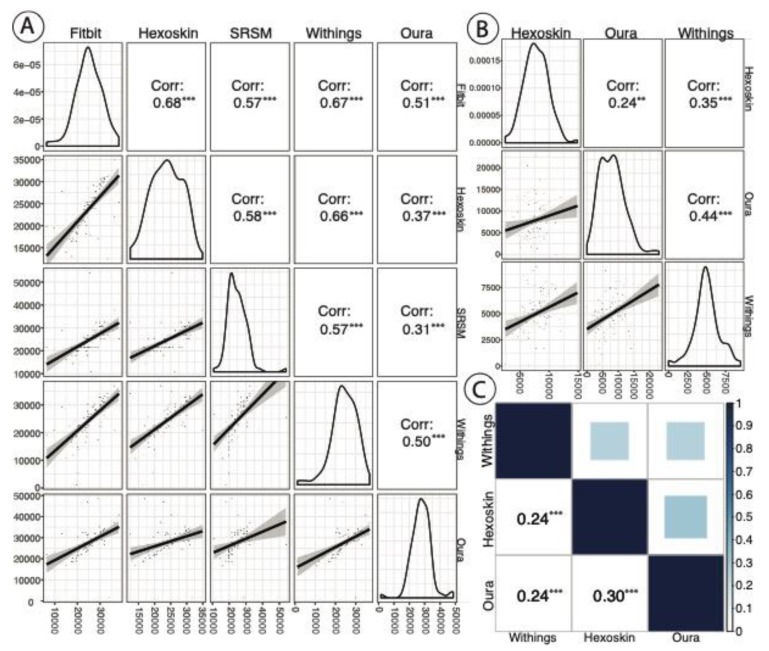
Figure 2.
(A) A correlation matrix of total sleep duration (TSD) (in seconds) by device and self-reported estimation (i.e., self-reported sleep metrics (SRSMs)) with p value significance indication (* p < 0.1; ** p < 0.05; *** p < 0.01). Each point represents data from each night for each participant. The plots in the diagonals of A and B reflect the distribution of sleep metric of interest (TSD and REM, respectively). (B) A REM sleep (in sec) correlation across the Oura, Hexoskin, and Withings devices with p value significance indication (same as above). The Fitbit was excluded, as it does not track REM vs. NREM sleep. for each individual device. The plots in the bottom left of A and B show the trend line with 95% confidence intervals between devices. (C) A correlation matrix of overall sleep stages (awake, NREM, and REM) between Oura, Hexoskin, and Withings devices (Fitbit does not differentiate between NREM and REM) with p value significance indication (same as above).

