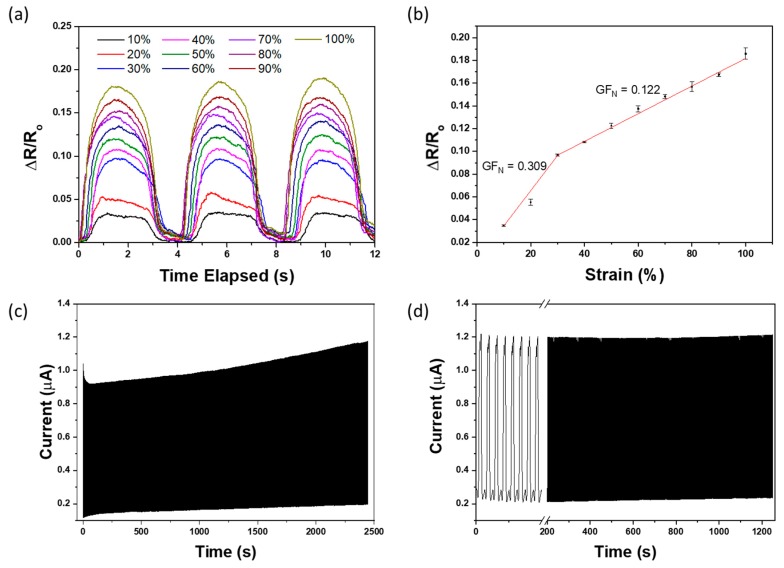
Figure 2.
(a) Plot of resistance change of E-skin sensor under an applied strain in the range of 10% to 100% with increment of 10% strain (b) Strain-response plots for the E-skin sensor. (c) Durability test of 1000 cycles 10% strain at a frequency of 0.4 Hz and (d) the performance of the strain sensor after 1000 strain cycles.

