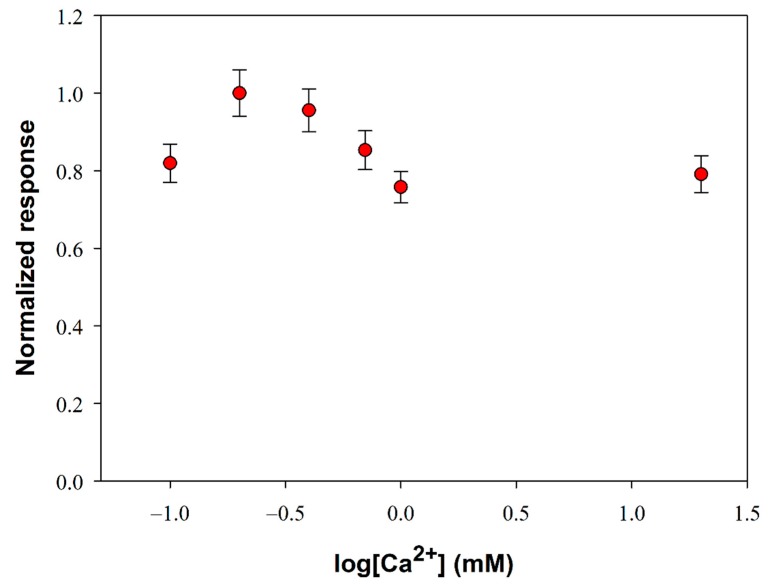
Figure 2.
Normalized response (i.e., response/maximum response) of a typical Pt/PPyox/ChO biosensor to PLD 0.22 IU/mL as a function of Ca2+ concentration. Supporting electrolyte: Tris buffer pH 8.0, I 0.05 M containing 0.75% (v/v) Triton X-100 and 5 mM phosphatidylcholine. Electrode rotation rate: 1000 rpm. Each value represents the mean of triplicate measurements; the error bars represent the relevant standard deviations.

