Figure 1.

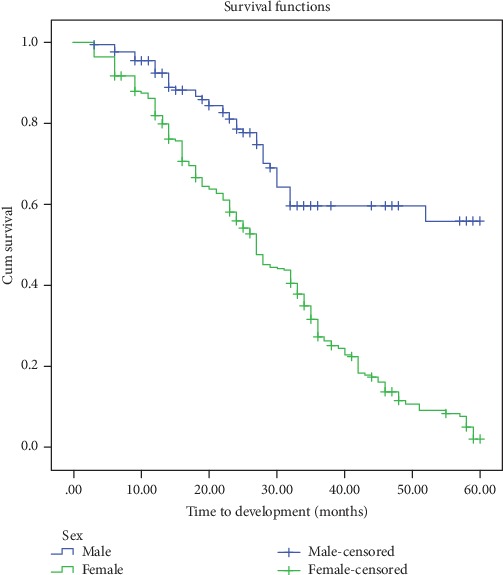
Kaplan-Meier curves for time to development of anemia, in months, among HIV patients on ART, Felege Hiwot Referral Hospital, 2012-2017, classified based on sex.

Kaplan-Meier curves for time to development of anemia, in months, among HIV patients on ART, Felege Hiwot Referral Hospital, 2012-2017, classified based on sex.