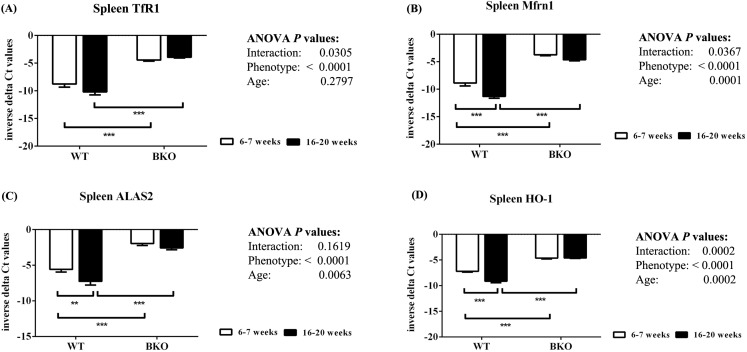
Figure 3. The expression of genes involved in hemoglobin biosynthesis and degradation in the spleen of wild type and thalassemic mice.
Quantitative RT-PCR of (A) Tfrc (TfR1) (B) Slc25a37 (Mfrn1) (C) Alas2 (ALAS2) (D) Hmox1 (HO-1) mRNA in the spleen of WT and BKO mice aged 6–7 weeks and 16–20 weeks. Relative mRNA expression was acquired by normalizing to Actb (β-actin) mRNA. Values are presented as means and SEM for minus delta Ct values (n = 5 per group). Statistical analysis was performed by 2-way ANOVA with Bonferroni post-hoc test. P-values for the effects of phenotype, age and interaction are shown in the figure. Statistical significance for pairwise comparison is indicated by * symbols (**P < 0.01, ***P < 0.001).

