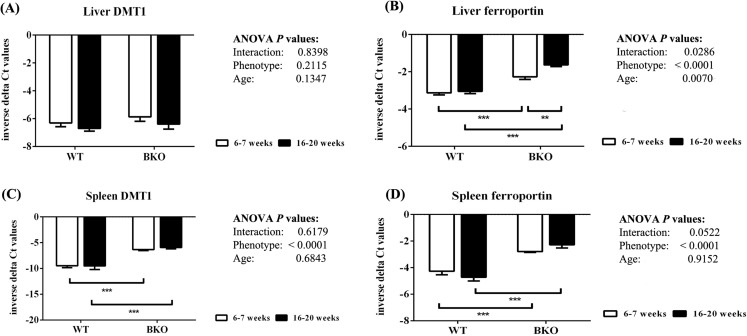
Figure 5. The expression of major iron transporters in the liver and spleen of wild type and thalassemic mice.
Quantitative RT-PCR of (A) Liver Slc11a2 (DMT1) mRNA (B) Liver Slc40a1 (ferroportin) mRNA (C) Spleen Slc11a2 (DMT1) mRNA (D) Spleen Slc40a1 (ferroportin) mRNA of WT and BKO mice aged 6–7 weeks and 16–20 weeks. Relative mRNA expression was acquired by normalizing to Actb (β-actin) mRNA. Values are presented as means and SEM for minus delta Ct values (n = 5 per group). Statistical analysis was performed by 2-way ANOVA with Bonferroni post-hoc test. P-values for the effects of phenotype, age and interaction are shown in the figure. Statistical significance for pairwise comparison is indicated by * symbols (**P < 0.01, ***P < 0.001).

