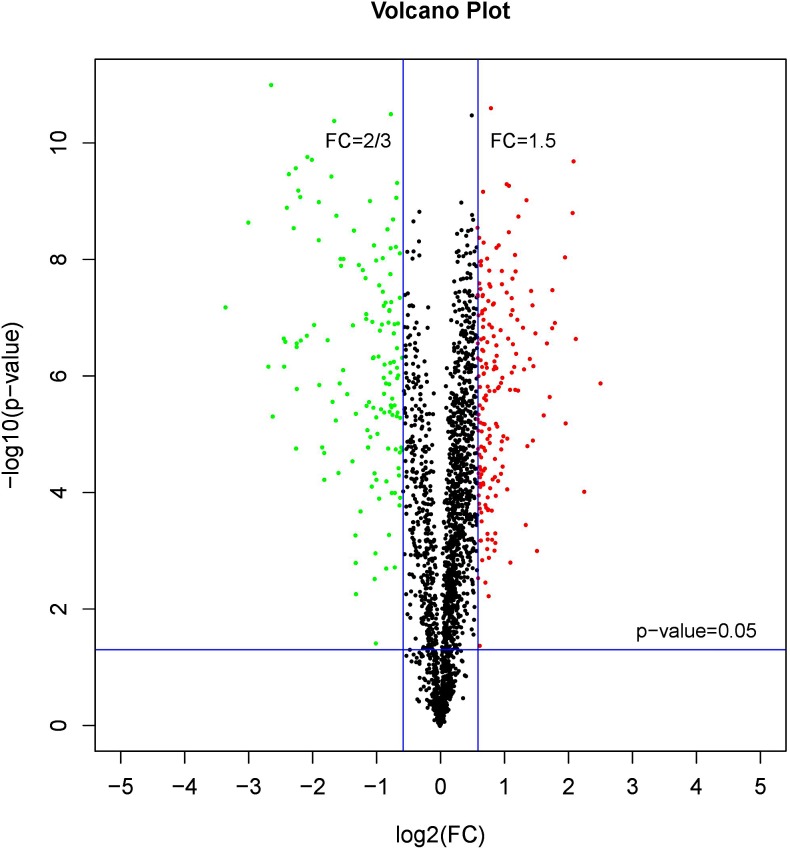
Figure 7. A volcano plots of DEPs under female compare with pseudomale.
The red indicated up-regulated proteins (p-value < 0.05 and FC > 1.5), green indicated down-regulated proteins (p-value < 0.05 and FC < 2/3), black indicated no significant change, the further the log2(FC) and −log10 (p-value) are from 0, the greater the difference in protein expression.

