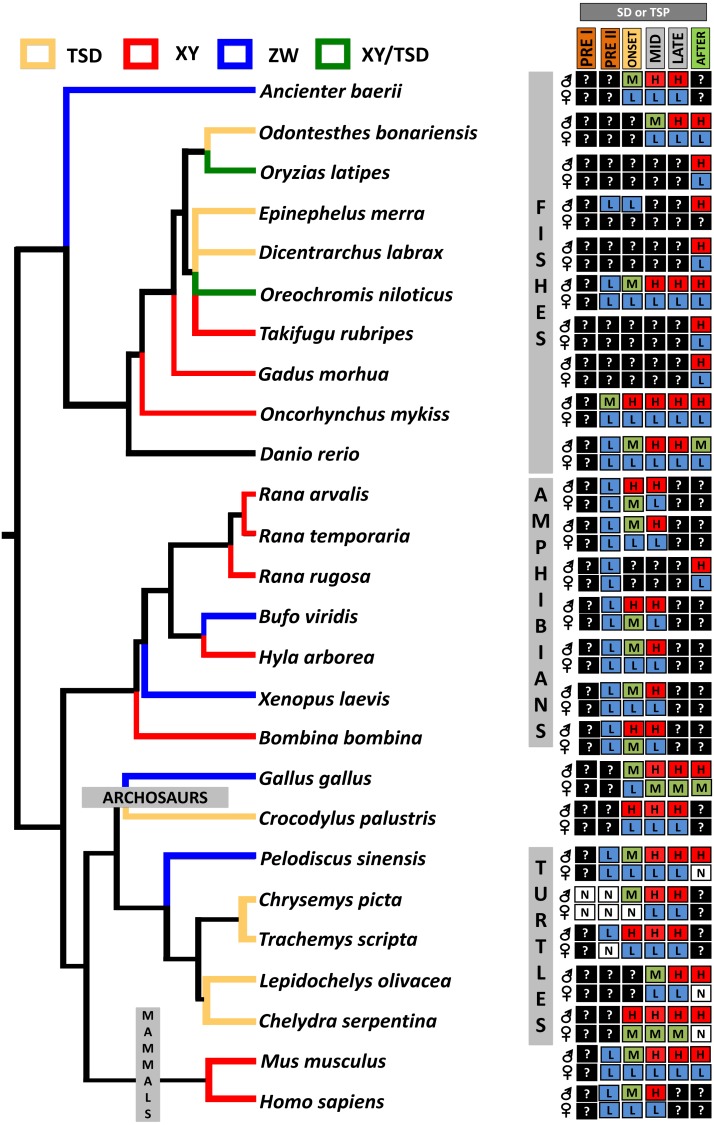
Figure 4. Transcriptional patterns of Dmrt1 during embryonic development of selected vertebrates with different sex-determining mechanisms.
Expression levels are color-coded as: none detected (white, N), low (blue, L), medium (green, M), high (red, H) transcription, and not studied (black, ?). Stages examined correspond to those before, during and after the thermosensitive period (TSP) for TSD taxa or sex differentiation (SD) for GSD taxa, following Valenzuela, Neuwald & Literman, (2013).

