
Figure 2.
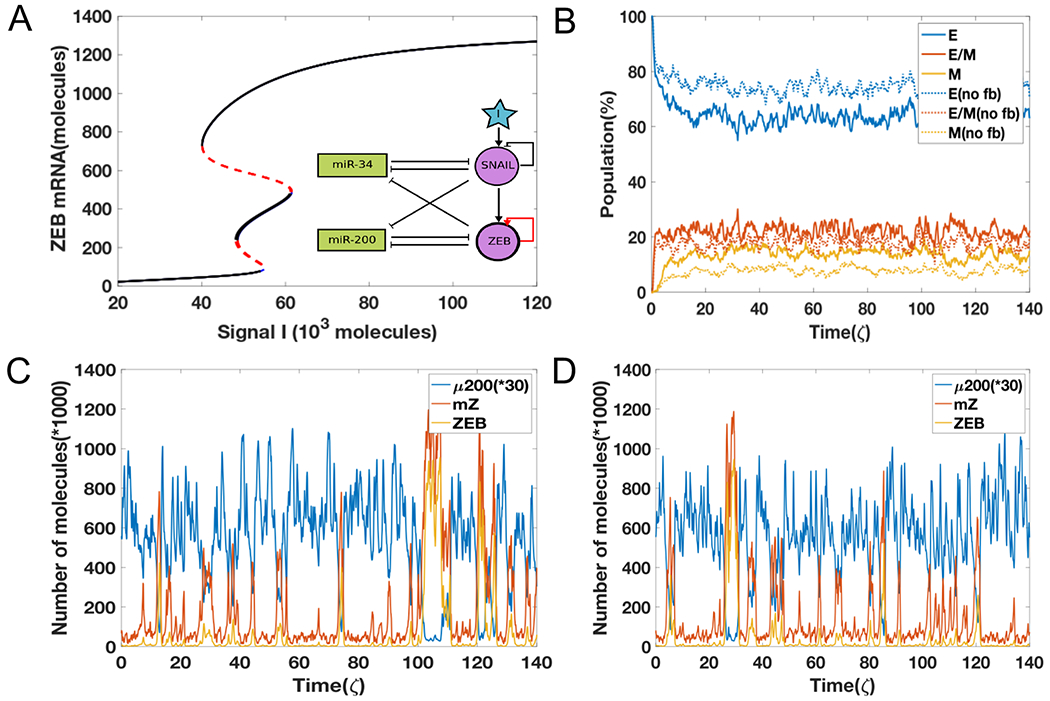
(A) The bifurcation diagrams for the EMT circuit shown in Fig 1, for varying values of α when epigenetic feedback acts through ZEB self-activation. The black curves representing stable states at finite feedback almost overlap with the blue ones for the no feedback case; red lines denote unstable states. (B) Simulations showing the population change as a function of time. The percentage is calculated based on 1000 independent simulations. Dashed lines represent the no epigenetic feedback case (α = 0), and solid lines are with feedback (α = 0.017). (C) A sample dynamic plot for the no feedback case. (D) A sample dynamic plot with the inclusion of feedback.