
Figure 3.
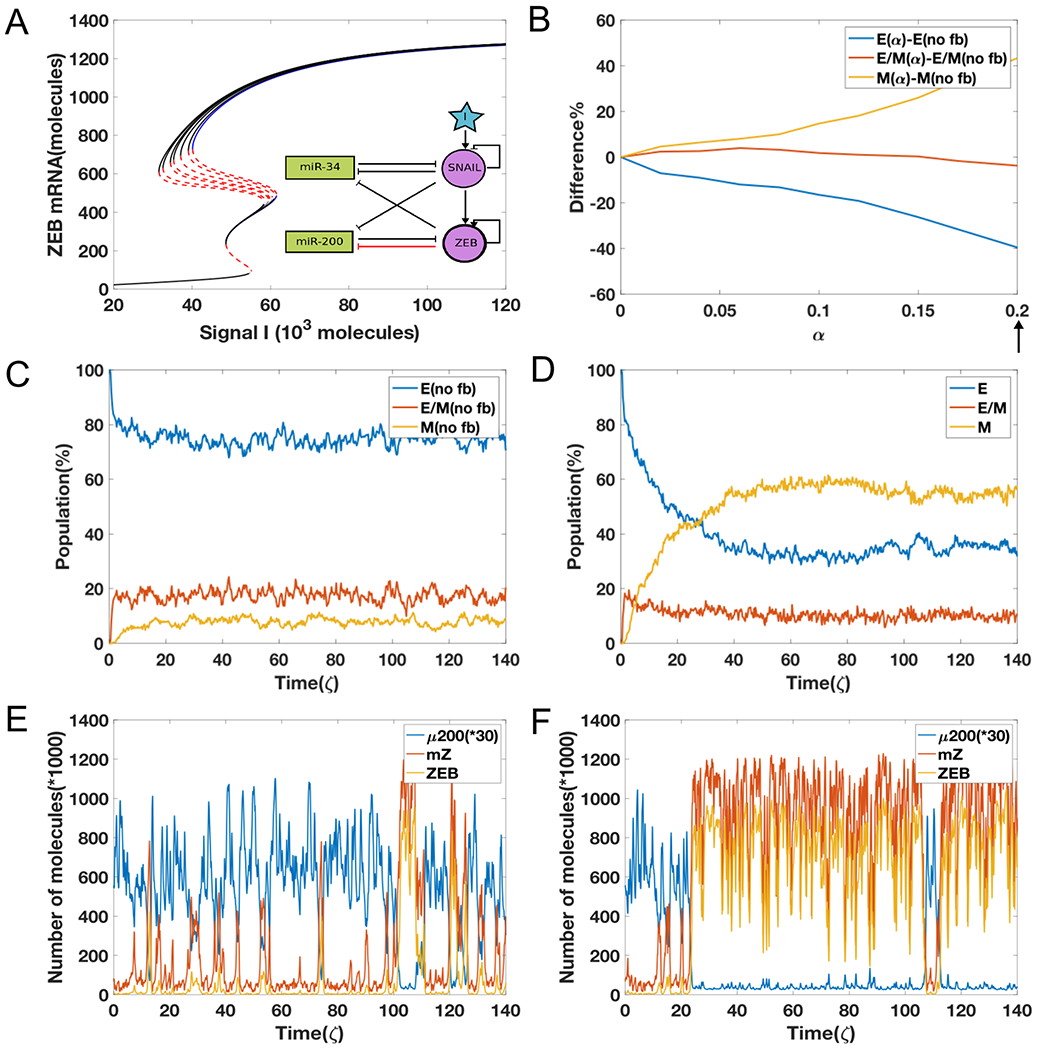
(A) The bifurcation diagrams for the EMT circuit shown in Fig 1A, for varying values of α when epigenetic feedback acts through the inhibition on miR-200 by ZEB. With increasing feedback, the bifurcation moves toward the left side in the mesenchymal region. The blue curve represents stable states in no feedback case and the black lines denote stable states with feedback; red lines denote unstable states. (B) The difference between equilibrium distribution population as a function of α. (C) A sample plot for the evolution of equilibrium population distribution for 1000 cells, as a function of time without any feedback (α = 0). (D) Same as Fig 3C but with strong feedback (α value is marked by arrow in 3(B), α = 0.2). (E) A sample dynamics plot for without feedback case (same as Fig 2C). (F) A sample dynamic plot for the case with feedback (α = 0.2).