Figure 5.

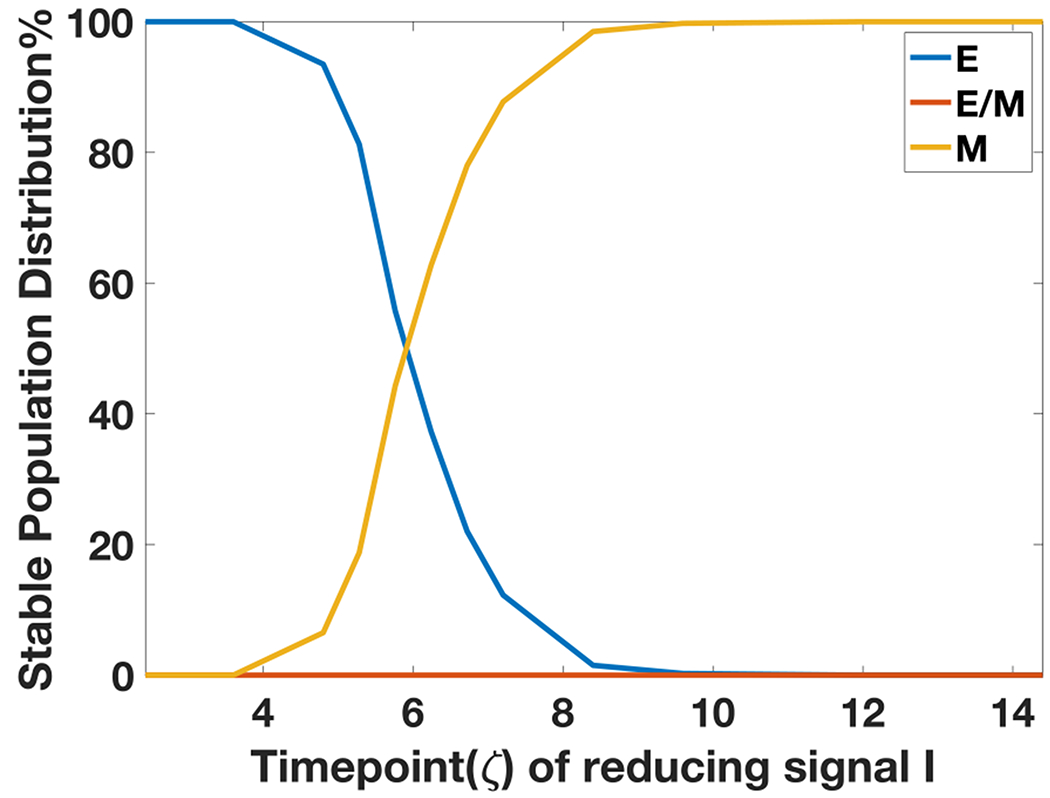
Steady state population distribution in E, E/M, M phenotypes for 1000 independent dynamical simulations of each case, as a function of the varying time durations of high I that the cells are exposed to.

Steady state population distribution in E, E/M, M phenotypes for 1000 independent dynamical simulations of each case, as a function of the varying time durations of high I that the cells are exposed to.