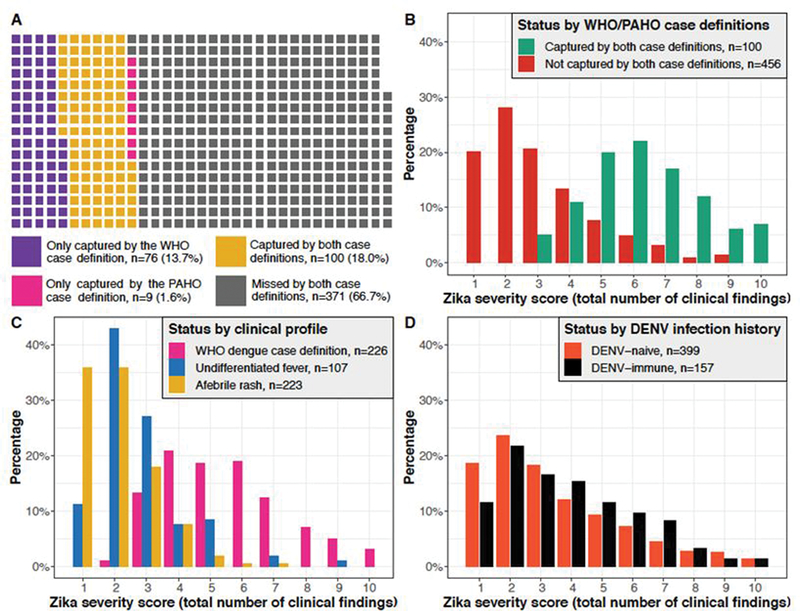
Figure 1. Distribution of the severity score in Zika cases by case definition and clinical profile.

(A) Waffle chart showing the degree of overlap between Zika cases captured by the WHO and PAHO case definitions. Each square represents one Zika case in the study. (B) The distribution of the severity score for the 556 confirmed Zika cases, stratified by whether the cases were captured by both the WHO and PAHO case definitions (yellow squares in Figure 1A) or not (purple, pink, and gray squares in Figure 1A). (C) The distribution of the severity score for the 556 confirmed Zika cases, stratified by clinical profile. (D) The distribution of the severity score for the 556 confirmed Zika cases, stratified by DENV infection history. DENV, dengue virus; PAHO, Pan American Health Organization; WHO, World Health Organization.
