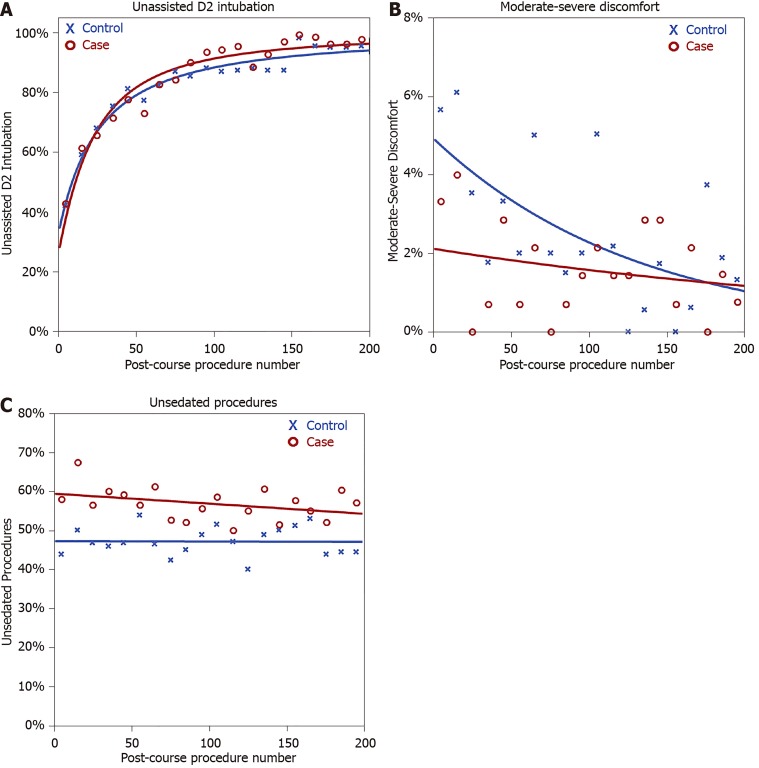
Figure 2.
Plots of outcome rates by post-course procedure number, stratified according to cases and controls. A: Unassisted D2 intubation rates; B: Rates of moderate-severe discomfort; C: Unsedated procedures. Trendlines are extrapolated from generalised estimating equation models, as described in Table 4.

