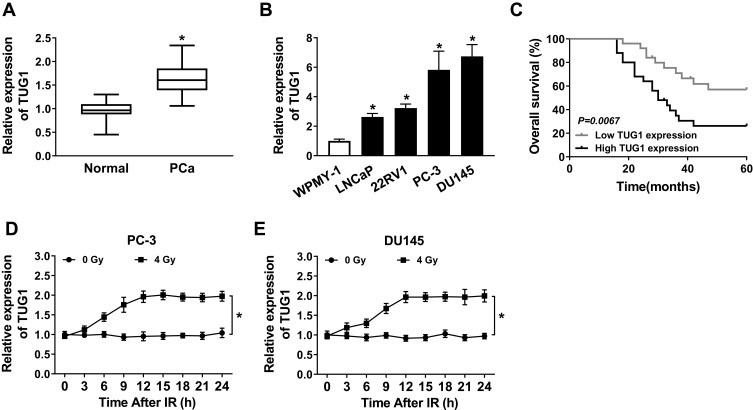
Figure 1.
Expression of TUG1 and its effect on prognosis and radiosensitivity in PCa. (A) The expression of TUG1 was measured by qRT-PCR analysis in PCa tissues (n = 50) or the adjacent non-cancer tissues. (B) The expression of TUG1 was measured by qRT-PCR analysis in human normal prostatic stromal immortalized cell line (WPMY-1) and PCa cell lines (LNCaP, 22RV1, PC-3 and DU145). (C) Survival was analyzed and compared between patients with high and low levels of TUG1 using Kaplan–Meier analysis. (D and E) TUG1 expression was detected in PC-3 and DU145 cells every 3 hrs after 0 or 4 Gy of radiation treatment. *P < 0.05.

