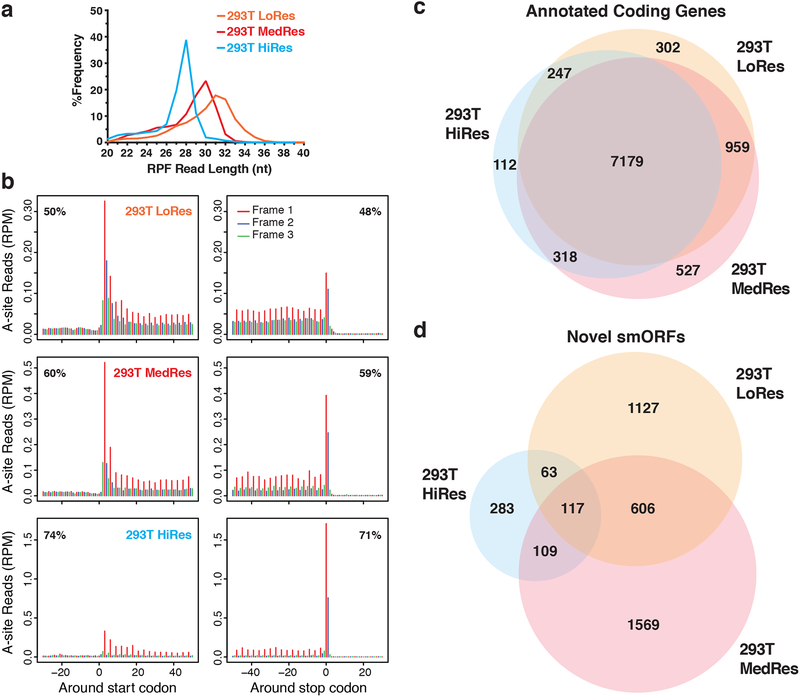
Figure 2. Comparison of translation prediction for smORFs versus annotated ORFs.
a RPF read length distribution plot showing the differences in footprint sizes across HEK293T Ribo-Seq datasets. Biological replicates were subjected to increasing RNase I nuclease digestion resulting in a range of Ribo-Seq resolutions: low (LoRes), medium (MedRes), and high (HiRes). The expected RPF size is 28-nt. b Metagene plots showing RPF read alignment around the start site and stop site for each dataset. The 5’-position of each RPF read was shifted to the ribosomal A-site and then mapped to all hg19 RefSeq coding transcripts. The metagene coding region is in frame 1, while frame 2 and frame 3 are out-of-frame. The percentage of in-frame reads is noted in the top corner. 28–34 nt reads were used for LoRes, 29–33 nt for MedRes, and 25–29 nt for HiRes. c Venn diagram showing overlap of annotated RefSeq genes passing RibORF scoring between all three HEK293T Ribo-Seq datasets. d Venn diagram showing overlap of novel protein-coding smORFs passing RibORF scoring and our smORF filters.

