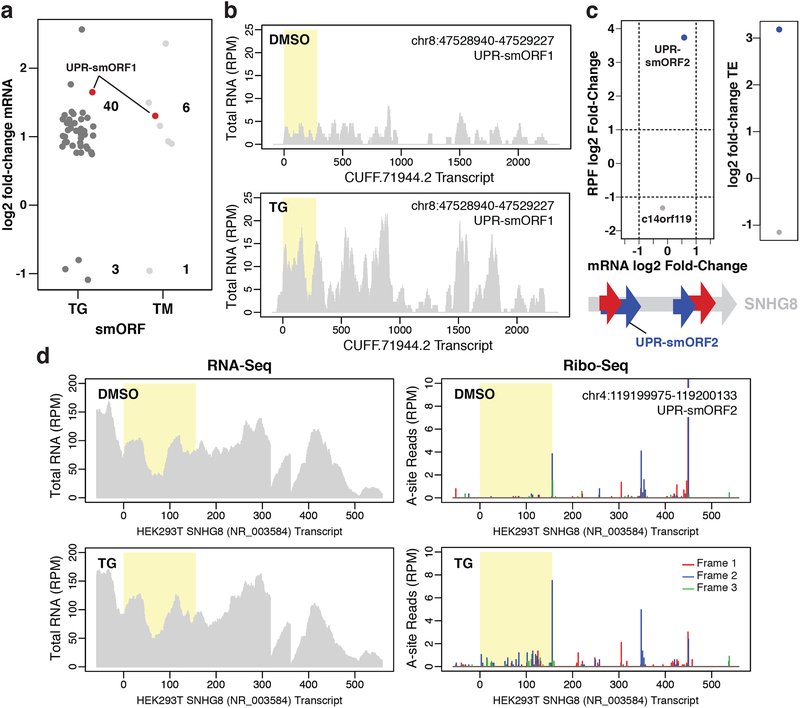
Figure 3. smORF regulation during ER stress.
a Changes in mRNA expression for novel smORFs induced by 1 μM TG or 5 μg/mL TM for 4 h relative to DMSO treatment (padj < 0.05). Only smORFs identified in at least two Ribo-Seq experiments were considered. The novel predicted translated smORF UPR-smORF1 is shown in red. Two biological replicates for each condition were analyzed. b Representative RNA-Seq read coverage plots for the unannotated de novo assembled transcript, CUFF.71994.2, with UPR-smORF1 highlighted in yellow. The y-axes show the intensity of read peaks in reads per million (RPM). c, top Changes in mRNA expression versus changes in RPF levels for a novel smORF found on SNHG8, UPR-smORF2, and the annotated smORF c14orf119 in response to TG treatment. Plot showing the resulting change in translational efficiency (TE, ΔRPF/ΔmRNA) is also shown (padj < 0.1). c, bottom Schematic showing the location of UPR-smORF2 on the SNHG8 transcript. Four novel smORFs were identified at least twice on SNHG8: two in frame 1 and two in frame 2. d Representative RNA-Seq read coverage and ribosomal A-site plots (Ribo-Seq) for SNHG8 with UPR-smORF2 highlighted in yellow.

