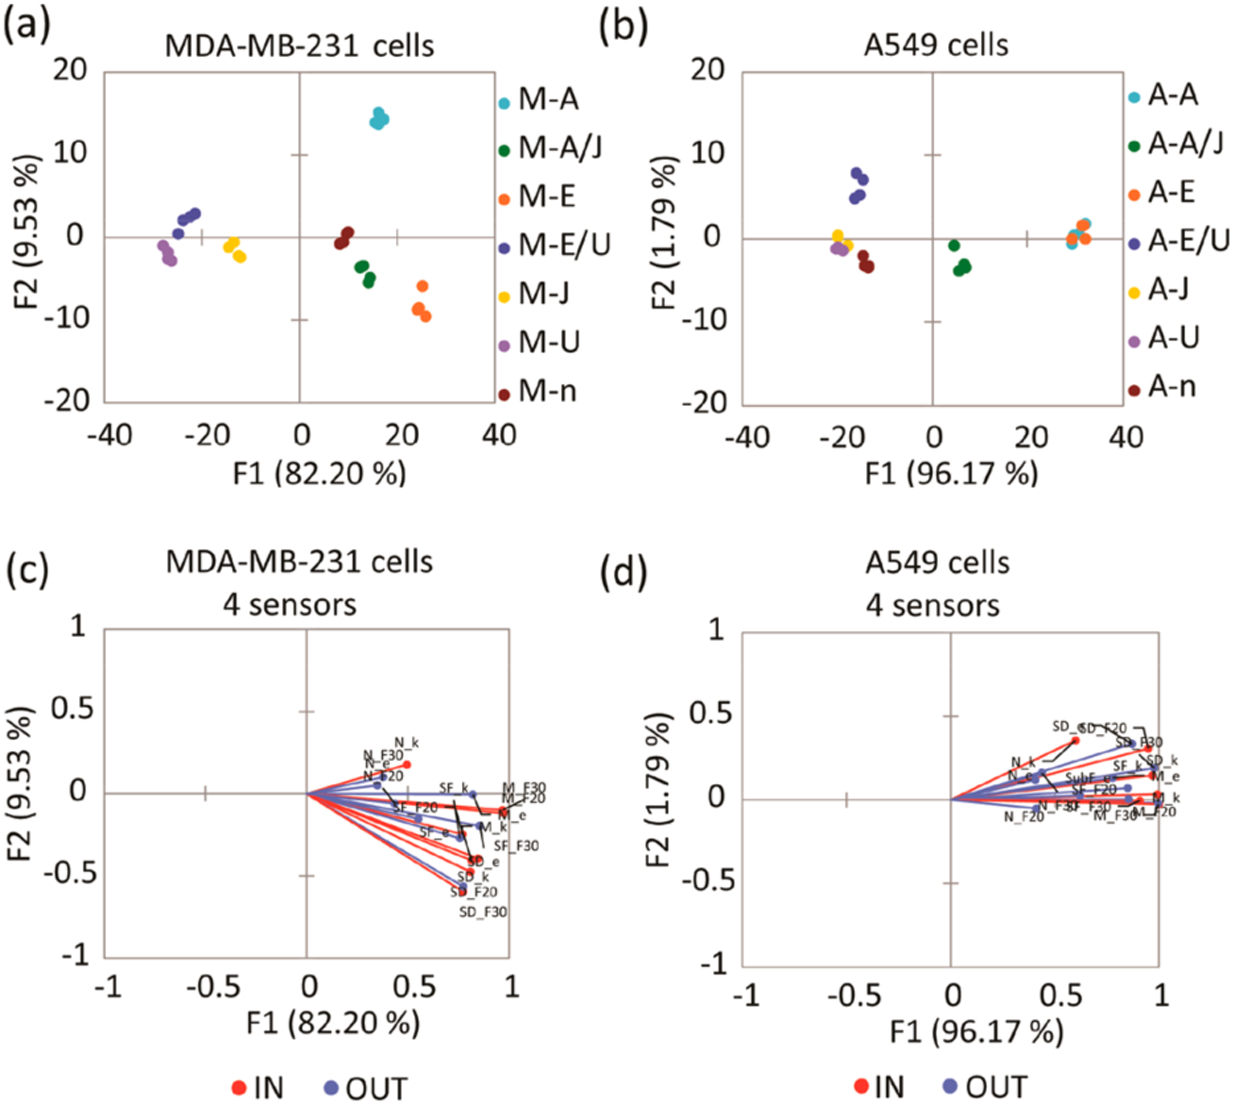
Figure 2.

(a) LDA score plot of the fluorescence response pattern of MDA-MB-231 cell lines with different treatments, showing 100% cross-validation. (b) LDA score plot of the fluorescence response pattern of A549 cell lines with different treatments, showing 92.86% cross-validation. Serum-starved control (n), inhibition of ERK phosphorylation by U0126 (U), induction of ERK phosphorylation by EGF (E), cells treated with U0126 then induced by EGF (E/U), inhibition of JNK pathway by JNK-IN-8 (J), induction of JNK phosphorylation by anisomycin (A), cells treated with JNK-IN-8 then induced by anisomycin (A/J). (c, d) Loading plots of the response from the sensing array showing differentiation of sets of lysates from serum starved, inhibited, or stimulated MDA-MB-231 (c) and A549 (d) cell lines with 100% and 92.86% cross-validation using 4 sensors. Vectors corresponding to each sensor contribution to the differentiation of lysates, SOX-SubD (SD_F30,F20,k,e), SOX-MEF2A (M_F30,F20,k,e), SOX-SubF (SF_F30,F20,k,e), and SOX-NFAT4 (N_ F30,F20,k,e) are colored in blue and red. F30, F20, k, and e correspond to ΔF (30 min), ΔF (20 min), rate constant, and error, respectively.
