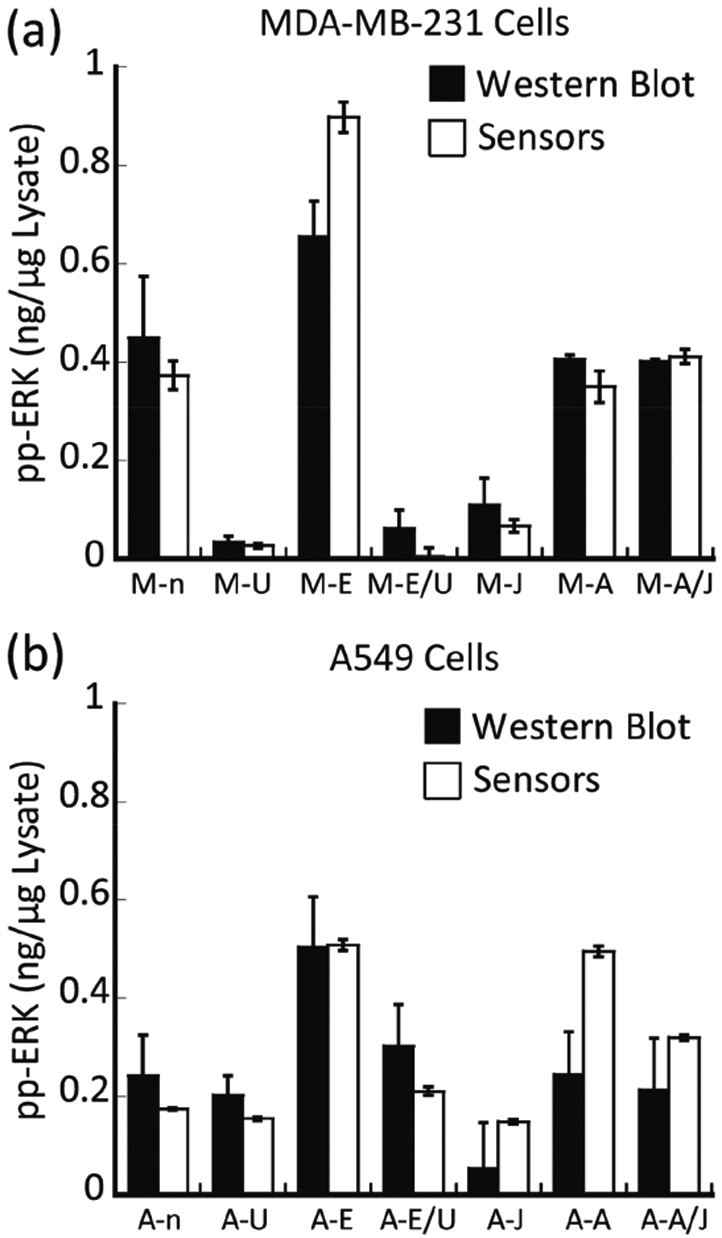
Figure 4.

Comparing the estimated amount of active ERK in the tested lysates using two different protocols. The amount of active ERK in different MDA-MB-231 (a) and A549 (b) cell lysates was calculated using both the SVM calibration models (the sensors) and the Western blot. Serum-starved control (n), cells treated with MEK inhibitor U0126 (U), cells induced with EGF (E), cells treated with U0126 then induced with EGF (E/U), cells treated with JNK inhibitor JNK-IN-8 (J), cells induced with anisomycin (A), and cells treated with JNK-IN-8 then induced with anisomycin (A/J).
