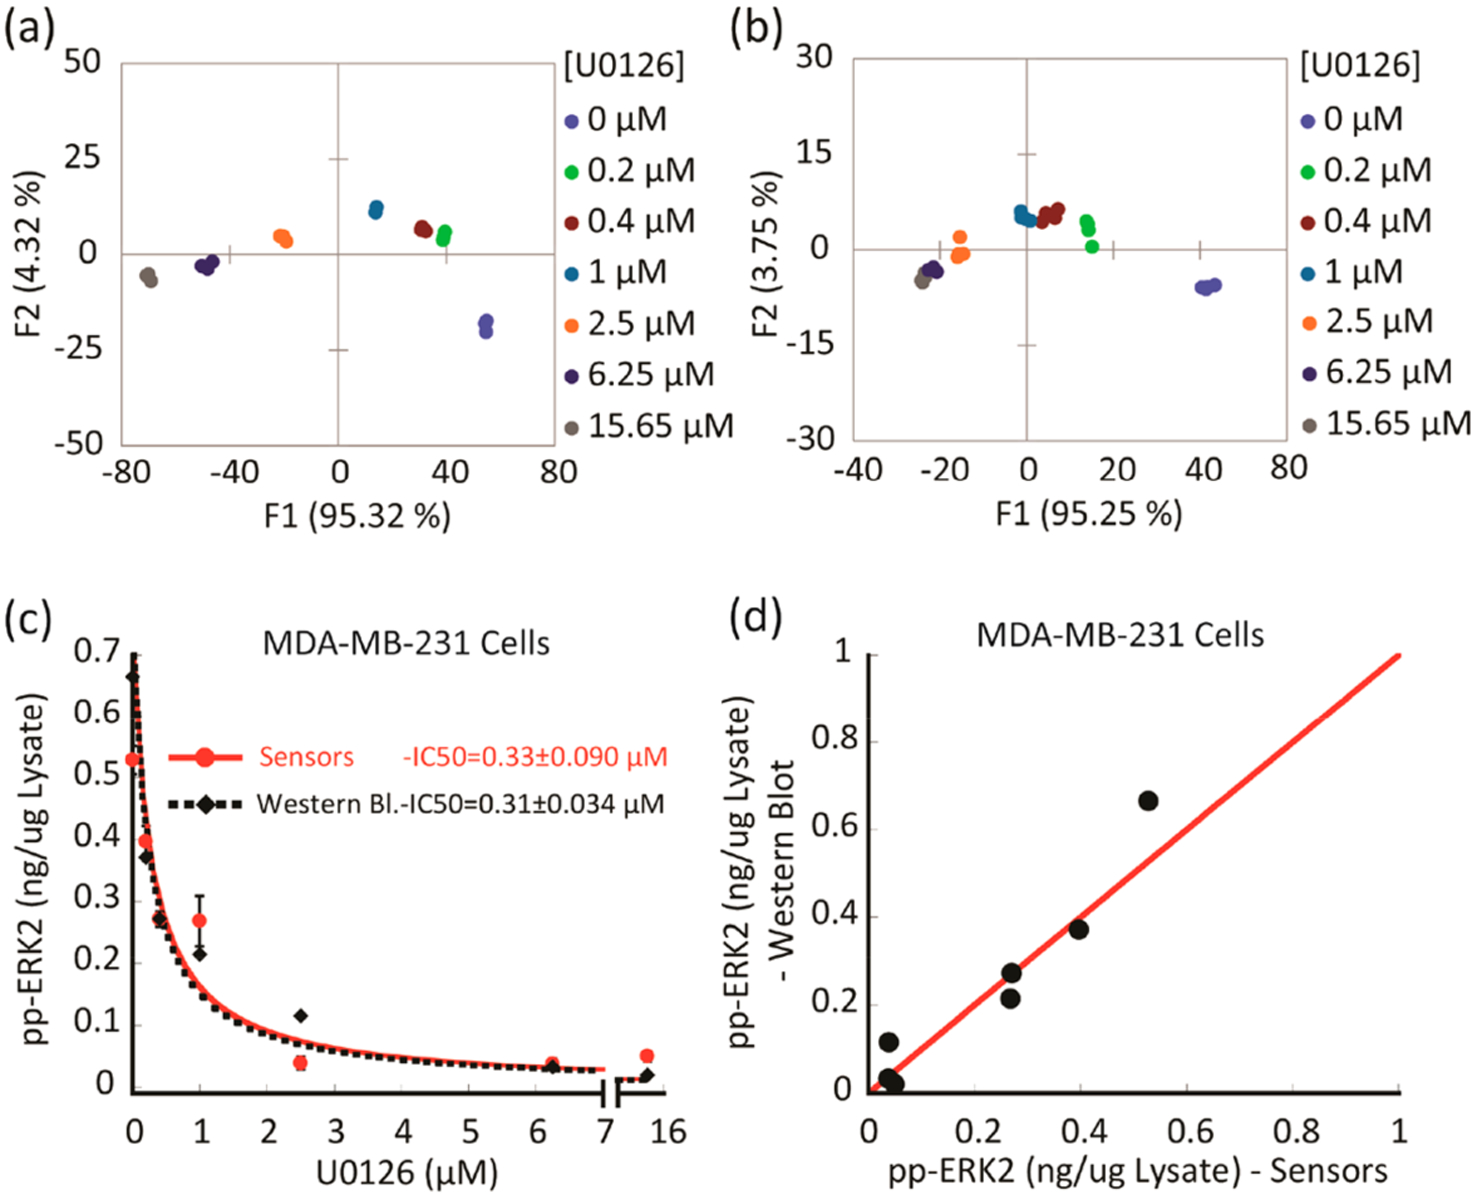
Figure 5.

Following ERK phosphorylation suppression in MDA-MB-231 cells treated with different doses of MEK inhibitor (U0126).(a, b) LDA score plots showing two experimental replicates of the response from the sensing array showing differentiation of lysates of MDA-MB-231 cells that were treated with increasing concentrations of MEK inhibitor (U0126) before induction with EGF and lysis. (c, d) Comparison between the amount of phosphorylated ERK, which was estimated using either the array sensor protocol or Western blot in the MDA-MB-231 cell lysates. (c) Plot of suppressed ERK phosphorylation versus increasing concentration of MEK inhibitor (U0126) determined by the array sensors (red dots) and Western blot analysis (black diamonds). Data were fitted to equation 1 (Table S6 footnote). (d) Scatter plot of suppressed ERK activity, showing a correlation of the values obtained with both methods. The red line corresponds to a linear correlation of 1.0.
