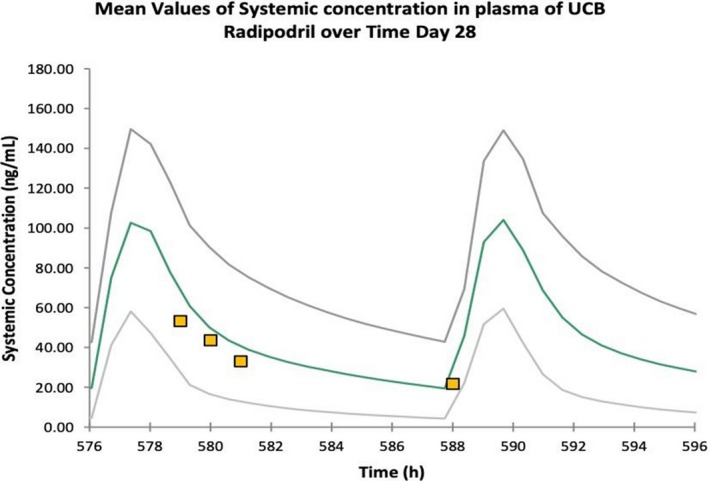
Figure 3.

Predicted and observed Radiprodil plasma concentrations. The curves represent the modeling‐based projected plasma concentrations (green curve is mean ± 95% confidence limits) for the mid dose selected for the clinical trial after 28 days of dosing. The individual data points are the observed concentrations for this dose in the first infant in the trial.
