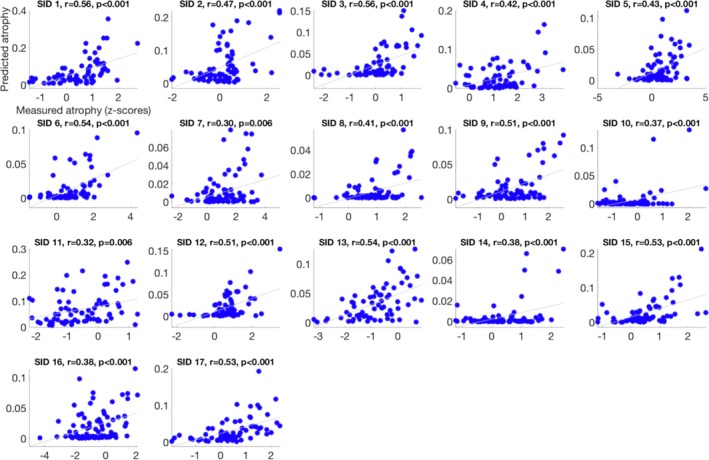
Figure 3.

Scatterplots showing a linear association between predicted and measured atrophy in 17 subjects. Subject‐specific (represented by Subject ID (SID)) Pearson correlation coefficient values (R) and associated P values are provided within each scatterplot.
