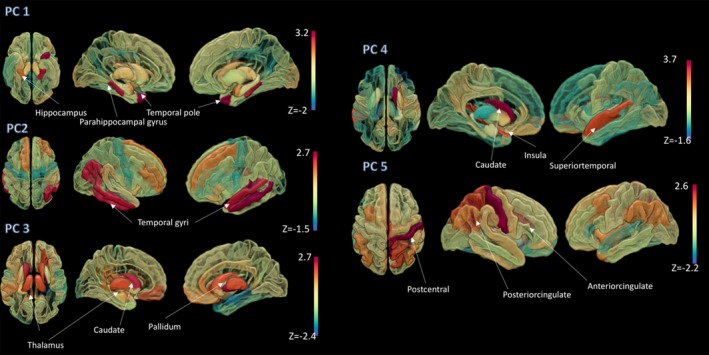
Figure 4.

Patterns of injury epicenters. The first five principal components, explaining 68% of the variance, in the atrophy maps predicted by network diffusion modeling. Spatial maps corresponding to the coefficient of the corresponding eigenvectors (first to fifth), sorted from top (first eigenvector) to bottom (fifth eigenvector) are overlaid on a surface brain.
