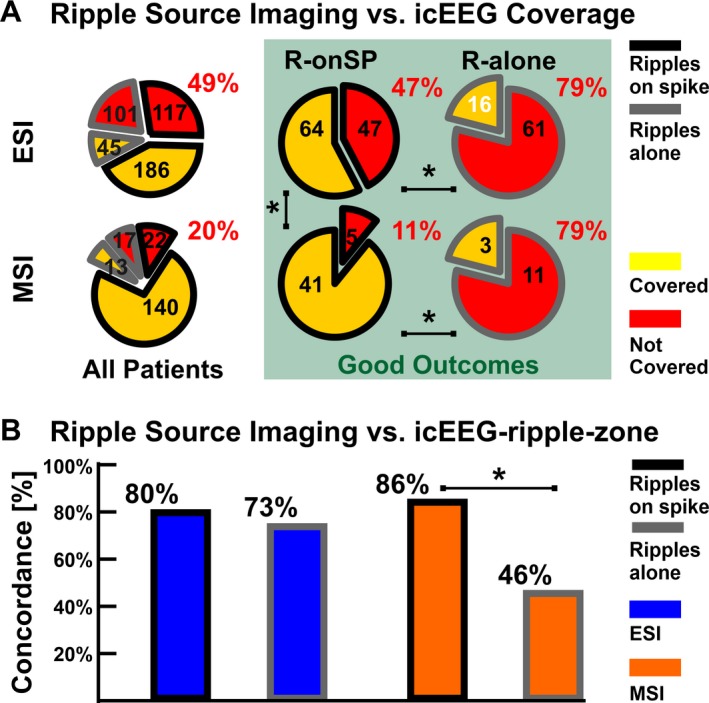
Figure 4.

Validation of Ripple Source Imaging against icEEG. Significant differences (P < 0.05) are marked by an asterisk (*). (A) Proportion of ripple sources covered by icEEG contacts (yellow wedges) or not covered (red wedges) by ESI (top) and MSI (bottom), separated into ripples‐on‐spikes (black border) and ripples‐alone (grey border). Green frame reports the results restricted to good outcome patients. (B) Proportion of ripple sources concordant with icEEG‐ripple‐zone.
