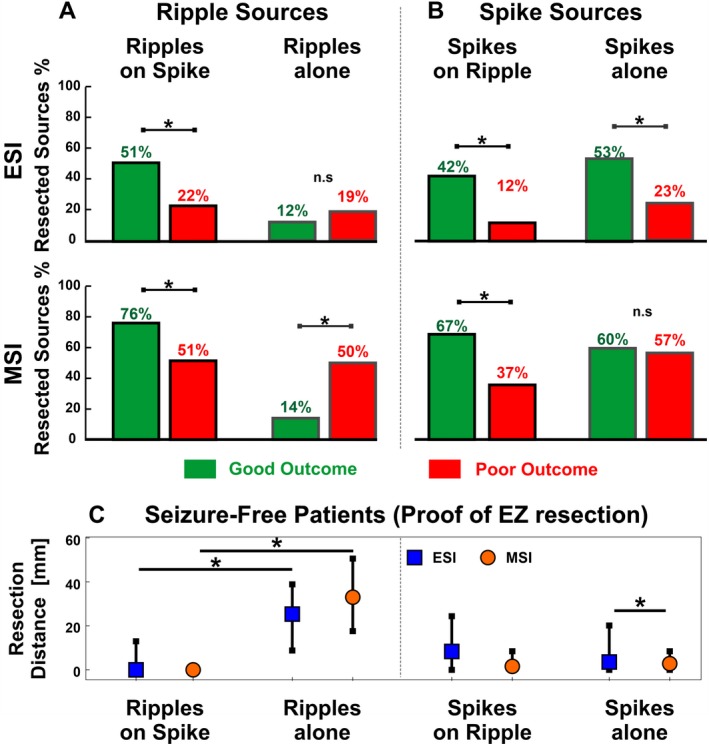
Figure 5.

Overlap of Ripple and Spike Sources with Resection. (A–B) Proportions of ripple sources (A) and spike sources (B) localized inside the resected area in the good outcome (green bars) and poor outcome groups (red bars). (C) Distance of ripple sources (left) and spike sources (right) from the resected area in case of proof of EZ resection, that is, in good outcome patients (n = 10). Medians (square or dot) and IQRs (whiskers) are shown. Significant differences (P < 0.05) are marked by an asterisk (*).
