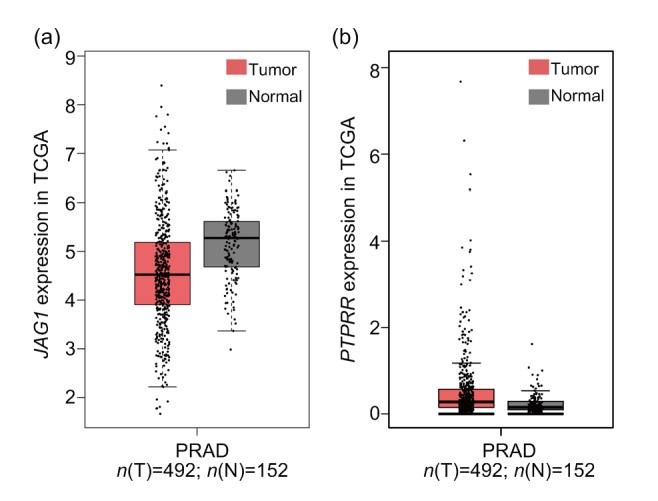
Fig. 7.

Expression of the key genes JAG1 and PTPRR in TCGA with GEPIA
(a) JAG1; (b) PTPRR. Red represents prostate cancer tissues and grey represents normal tissues. JAG1: Jagged1; PTPRR: protein tyrosine phosphatase receptor-type R; TCGA: The Cancer Genome Atlas; GEPIA: Gene Expression Profiling Interactive Analysis; PRAD: prostate adenocarcinoma
