
Figure 3.
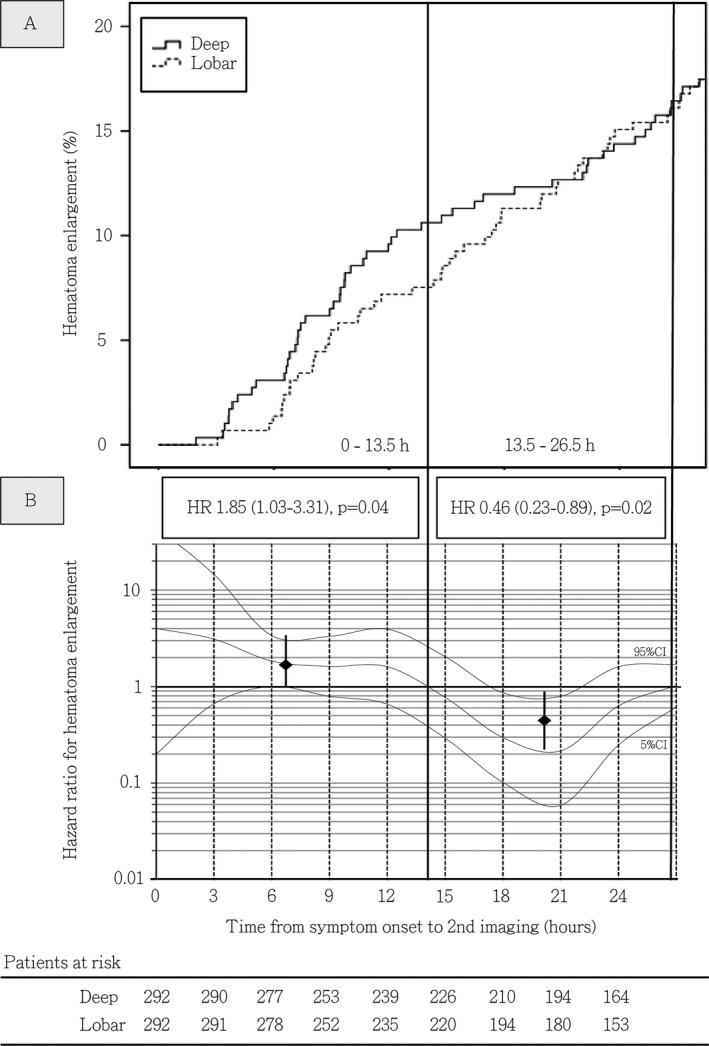
Incidence rates and time‐dependent hazard ratios for hematoma enlargement in patients with deep versus lobar ICH. (A) Incidence rates of hematoma enlargement detected through control imaging during the hyperacute course of deep and lobar ICH management in propensity‐matched cohorts. (B) Time‐dependent hazard ratios for hematoma enlargement in deep versus lobar ICH patients. Adjusted COX proportional hazard models were calculated for propensity‐matched cohorts with additional adjustment for intraventricular hemorrhage and prior oral anticoagulation to visualize the association between time since symptom onset and detection of hematoma enlargement by control imaging in patients dichotomized according to supratentorial ICH location. Hazard ratio estimates (y‐axis) for deep ICH patients were calculated at each hour since symptom onset using time‐patient‐clusters (HR estimate at the median of a 5‐hour interval) of patients with control imaging at a median of the presented hour (x‐axis) and compared with lobar ICH patients with data points within these clusters. To correct for overestimation, we weighted and smoothed hazard ratios by the method of moving averages. The dashed lines indicate time intervals with increased risk for detection of hematoma enlargement identified by the intercept of the adjusted HR median with the HR of 1. Medians and 95% CI displayed as square with whiskers represent hazard ratios for HE in deep compared to lobar ICH during mentioned identified time intervals, that is, 0–13.5 and 13.5–26.5 h. Patients at risk included in both analyses (A + B) are displayed using 3‐hour intervals, showing comparable numbers of patients receiving control imaging at each time point from individual onset of deep or lobar ICH. Abbreviations: CI, Confidence interval; HR, Hazard Ratio; h, hours; ICH, Intracerebral hemorrhage.