Figure 1.
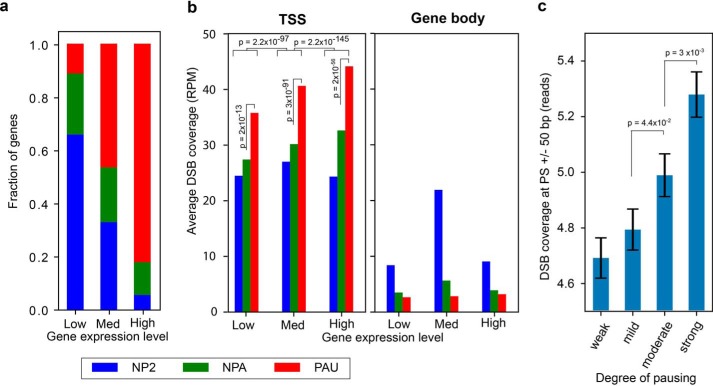
DSBs are clustered at TSSs of highly expressed paused genes in HeLa cells. a, fractions of PAU (red), NPA (green), and NP2 (blue) genes based on the traveling ratio derived from Pol II ChIP-seq of HeLa cells are indicated for low, medium (Med), and highly expressed genes based on RNA-seq data of HeLa cells. b, number of DSBs (RPM, reads per million reads) detected at TSSs ± 500 bp (left panel) or within the rest of the gene bodies (right panel) for the three gene expression groups. The p values were determined by two-sided Kolmogorov–Smirnov tests. c, DSB reads at pausing sites (n = 13,910) are stratified into four equal size groups (quartiles) based on pausing site ranks, established previously using multiple pausing-relevant data sets from HeLa cells (14). Error bars denote the standard error of the mean. The p values were calculated using a two-sided Mann–Whitney U test.

