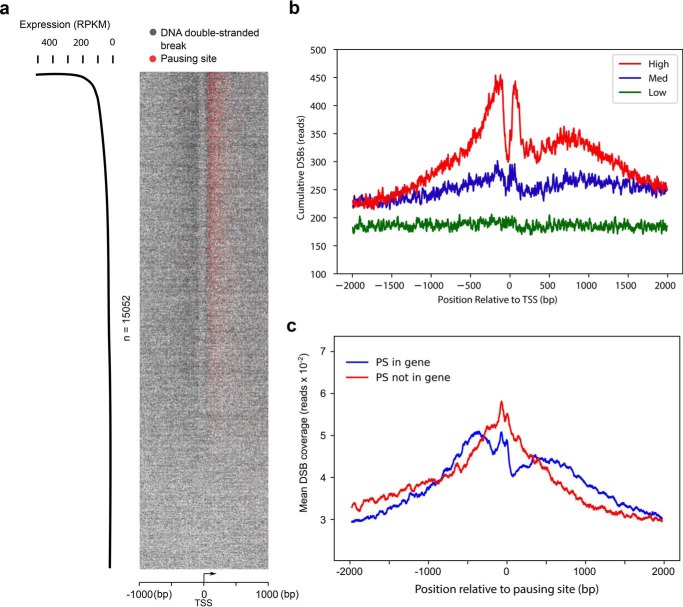
Figure 2.
DSBs are enriched at pausing sites. a, heatmap representation of DSBs (one gray dot per site) and PSs (one red dot per site) at transcription start sites of actively transcribed genes (RPKM > 0, n = 15,052). Pileups of breaks or PSs result in a darker color from overlaid dots. Genomic regions are ordered by gene expression based on RNA-Seq in HeLa cells. b, cumulative, single-nucleotide-resolution profiles of measured DSBs at TSSs of genes stratified by their levels of transcription: low, medium (Med), and high. c, DSBs are enriched at pausing sites regardless of the presence of annotated TSSs. Shown are average cumulative profiles of DSBs at pausing sites located within RefSeq-annotated genes (blue, n = 7,941) and not within genes (red, n = 5,969). The pausing sites within RefSeq genes were located about 100 nt downstream of TSSs, whereas the pausing sites in the latter group were located either in intergenic regions or enhancer/promoter regions of genes and farther away from the nearest TSS.

