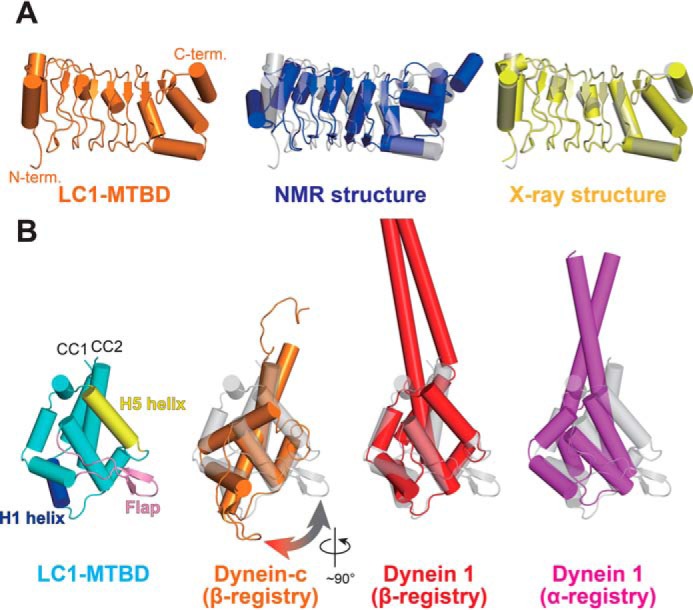
Figure 2.

Structural comparison of LC1 and MTBD in the LC1-MTBD complex with known structures. A, structural comparison of LC1. The LC1 structure in LC-MTBD, the NMR structure (PDB ID: 1M9L), and the X-ray structure (PDB ID: 5YXM) are shown in orange, blue, and yellow, respectively. B, structural comparison of the MTBD. The MTBD structure in LC1-MTBD, that of dynein-c (PDB ID: 2RR7), that of dynein 1 in β-registry (PDB ID: 5AYH), and that of dynein 1 in α-registry (PDB ID: 3J1T) are shown in cyan, orange, red, and magenta, respectively. Please note that only the structure of dynein-c was determined by NMR spectroscopy and the cylindrical presentation of α-helices are slightly different from others because of the loosely determined main-chain torsion angles.
