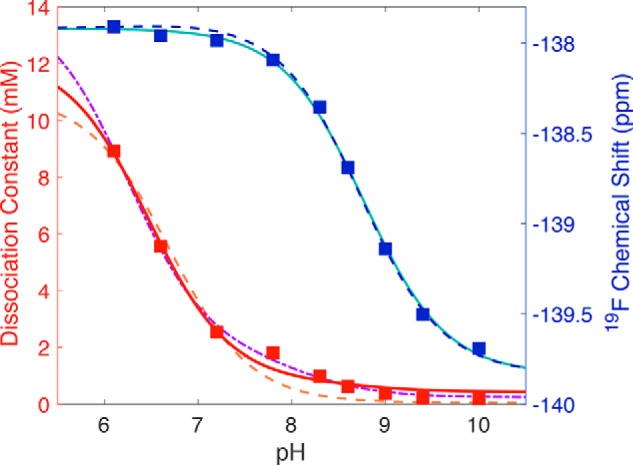
Figure 7.

Application of model 2 to the pH dependence of the 19F chemical shift (blue squares) and the observed dissociation constant (red squares) of 3F4HPA binding to WT C2. Dissociation constants determined at different pH values using Equation 2 are plotted against pH values (red squares) and compared with the predictions of the different models. Model 1 (Scheme 1) produced the fit shown with the orange dashed line obtained using Equation 1, which yielded a high-pH limiting dissociation constant of 0.05 ± 0.01 mm for the L·EH complex and a pKLH(EH) of 6.7 ± 0.1, using the free ligand pKa of 9.0. This model provided an inadequate description of the data near pH 8.0 and so was replaced by the two-proton model (Scheme 2). The resulting fit to the data using Equation 5 better reproduced the intermediate-pH behavior (dot-dashed purple line) and yielded a limiting Kd, L·EH of 0.025 ± 0.005 mm, pKEH of free enzyme of 7.1 ± 0.2, pKLH(EH) for ligand bound to protonated enzyme of 6.2 ± 0.1, and pK(L)EH for enzyme with deprotonated ligand bound of 8.1 ± 0.2. The pH dependence of the chemical shift was well-described by the Henderson-Hasselbalch equation (Equation 3), yielding a pKa of 8.77 ± 0.03 (teal line). When the chemical shift and Kd, obs were fit simultaneously in Matlab, the intermediate pH behavior of Kd, obs was not as well-described (red solid line), but the parameters obtained from the simultaneous fit are comparable with those obtained from fits to each of chemical shift and Kd, obs alone, and the chemical shift's pH dependence was quite well-described (blue dashed line). Obtained parameters are provided in Table 1.
