Figure 1.
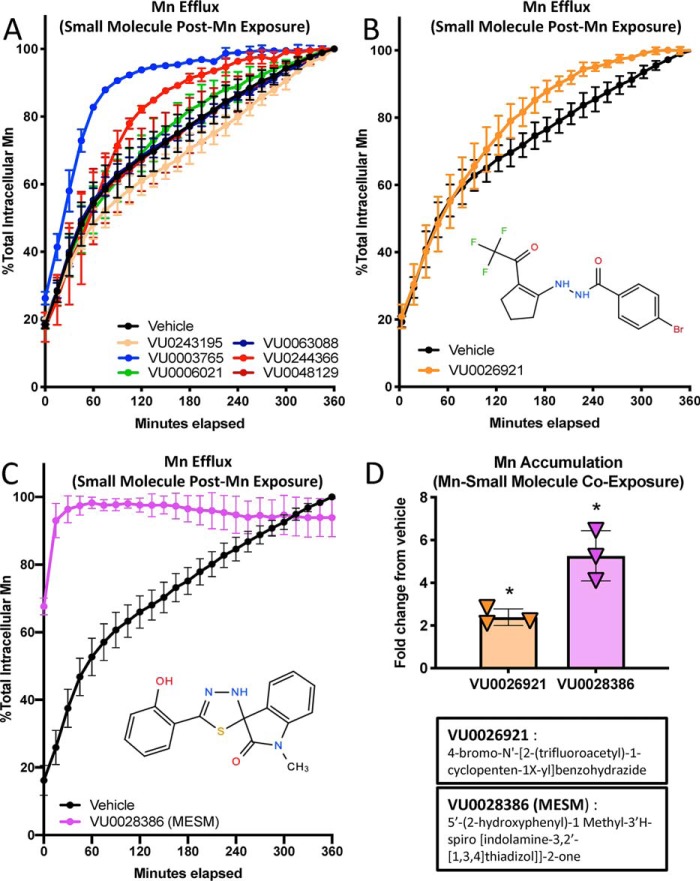
Small molecule VU0028386 (MESM) rapidly induces cellular efflux of Mn. Cells of the murine striatal neuron lineage, STHdhQ7/Q7 (Q7), were pre-exposed to 125 μm MnCl2 for 2 h in HBSS before washing away the extracellular Mn and allowing the cells to efflux their intracellular Mn to the extracellular space in PBS (lacking Ca2+ and Mg) with co-incubation of a small molecule (10 μm). Fluorescent dye (Fura-2; 500 nm) was added to the PBS so its fluorescence could be quenched by effluxed Mn. Fluorescence of Fura-2 was measured at 360/535 (excitation/emission) every 15 min for 6 h at 37 °C, and Mn was calculated based on percent fluorescence quenching. The maximum quantity of Mn effluxed after 6 h was normalized to 100%. A, representative sample from a partial screen of small molecules performed in duplicate was performed (all 22 molecules can be seen in Fig. S1). B, following the screen, small molecule VU0026921 was assayed again (total n = 3) as another “Mn-increaser” to compare with VU0028386 (MESM), which was also assayed again (total n = 6) for confirmation of its efflux kinetics. C, sum of squares F-test comparison of MESM and vehicle data sets, using a nonlinear regression model of one-phase exponential decay, determined both data sets fit significantly different curves (p < 0.001). The biological half-life (t½) of Mn efflux in vehicle was calculated at 79.11 min. In comparison, the efflux of Mn with MESM is so fast a half-life value cannot be accurately calculated as the 50% mark occurs before measurement begins. Considering the lag time between assay and measurement, we can estimate the half-life value is less than 2 min. Error bars are the standard deviation of the biological replicates from each experiment. D, STHdhQ7/Q7 (Q7) was co-incubated with a known “Mn-increaser” VU0028386 or VU0026921 at 10 μm or 0.1% DMSO (vehicle) with 125 μm MnCl2 for 2 h in HBSS. Cells were washed five times in PBS to remove extracellular Mn. Cells were lysed open with Triton, and intracellular Mn was quantified using the CMFEA method, as described previously (38). Mn levels were normalized to vehicle levels, and their fold-change is plotted (n = 3). Error bars shown represent standard deviation (A–D). An ordinary one-way ANOVA with Dunnett's multiple comparisons test to vehicle to show statistical significance for intracellular Mn accumulation increases (*, p < 0.05).

