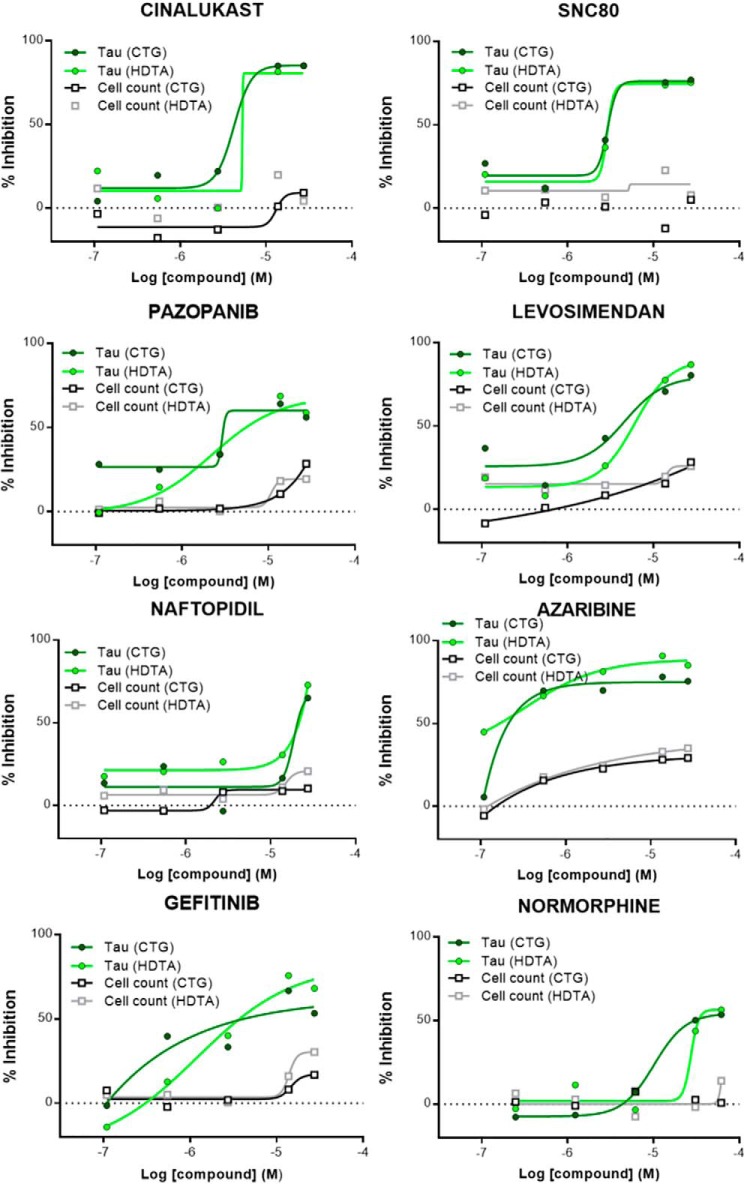
Figure 2.
Concentration–response profiles of hit compounds from the NCATS Pharmaceutical Collection screened in the T40PL–GFPagg cell tau inclusion assay. Data are plotted showing the inhibition of T40PL–GFP aggregates (expressed as % inhibition) after CTG or HDTA extraction. In addition, compound-mediated cytotoxicity is shown as measured by an analysis of DAPI-positive nuclei after each extraction method. All compounds were analyzed as singletons at five concentrations (110 nm to 2.75 μm), with curve fitting as described under “Experimental procedures.”

