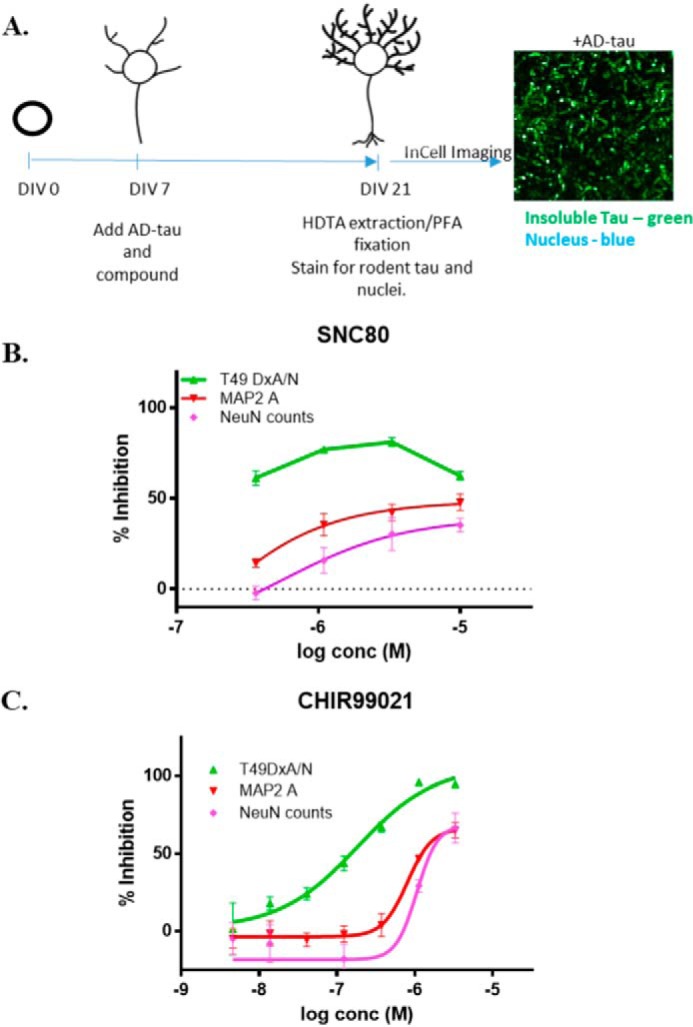
Figure 4.

A, schematic representation of the protocol for 384-well compound screening using the optimized rat cortical neuron assay of tau inclusion formation, including a representative image of the tau pathology and DAPI-positive nuclei remaining after HDTA extraction and PFA fixation. B, concentration–response analysis of SNC-80 in the rat cortical tau inclusions assay, with insoluble tau (T49 DxA/DAPI nuclei), MAP2 area, and NeuN counts shown as percent inhibition relative to vehicle-treated neurons. Triplicate wells were tested at each SNC-80 concentration, with error bars representing S.E. Sigmoidal dose-response curves were fit using GraphPad Prism, except for the T49 DxA/N measure in which data points were simply connected by lines due to an incomplete sigmoidal curve in the tested concentration range. C, example concentration–response profile of CHIR-99021 in the rat cortical tau inclusion assay, with insoluble tau (T49 DxA/DAPI nuclei), MAP2 area, and NeuN counts shown. Triplicate wells were tested at each CHIR-99021 concentration, with error bars representing S.E. Sigmoidal dose-response curves were fit using GraphPad Prism.
