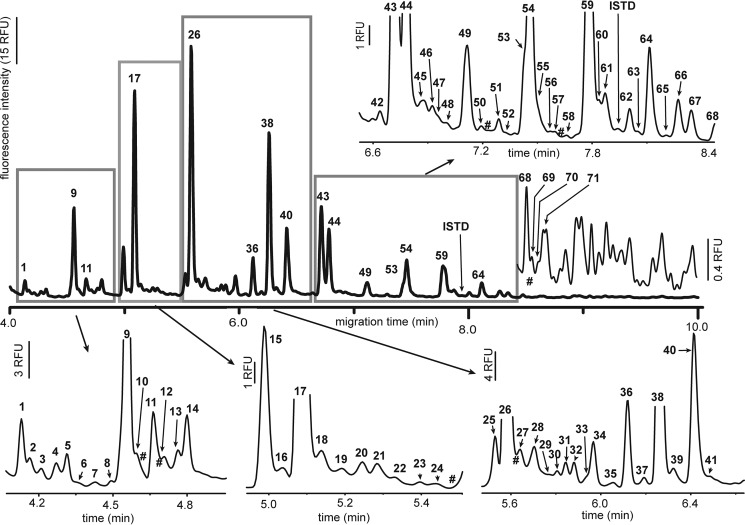
Figure 2.
Representative CE electropherogram of fluorescently labeled HMOs. Peaks attributable to HMOs were sequentially numbered (bold font); # indicates the migration times of HMOs observed in only one to three (of 16) samples. An original unscaled electropherogram is depicted with the bold line, and the boxed regions and the region from 8.4 to 10 min are individually scaled to more clearly illustrate the HMO peaks. Peak areas were recorded for all numbered HMOs; those above 71 could not be reliably aligned between different samples and were recorded collectively as the sum of all HMO peaks in this region. RFU, relative fluorescence unit.

