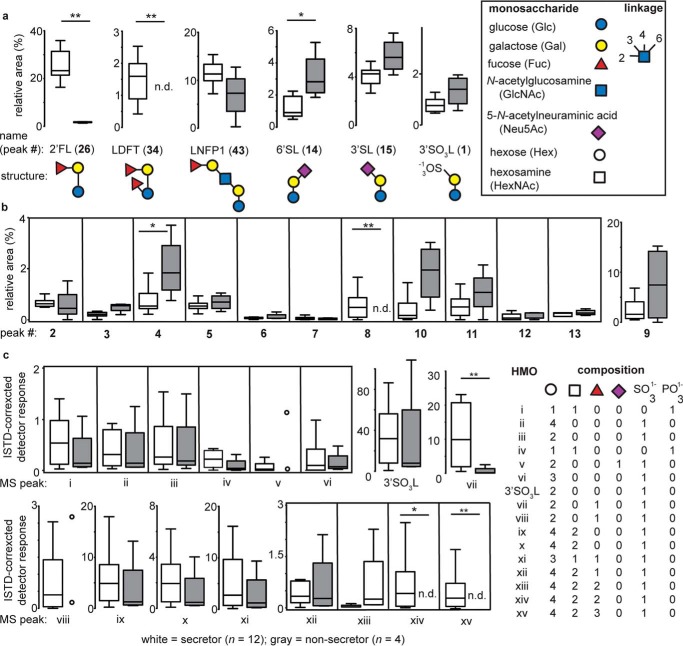
Figure 3.
Relative quantitation of sulfonated and phosphorylated HMOs by CE and HPLC-MS. a, CE analysis of HMOs permitted identification of maternal Se status based on significant differences in the relative levels of 2′FL, LDFT, and 6′SL (44). Numbers in bold font refer to CE peaks as numbered in Fig. 2. 3′SL and 3′SO3L, a sulfonated HMO previously identified in dairy milk samples, did not significantly vary with maternal secretor status. For all box-and-whisker plots, center lines depict medians, and box limits indicate 25th and 75th percentiles. Whiskers extend to 1.5 times the interquartile range. Open circles are used rather than box-and-whisker plots when fewer than four samples contained a specific HMO. b, with a single exception, all human milk samples contained a class of sulfate- or phosphate-bearing HMOs (HMO1–HMO6 and HMO10) with identical electrophoretic mobilities as those identified previously for the first time in bovine milk samples (38). The occurrence of several other peaks in this region (e.g. 7–9 and 11–13) suggests the presence of additional sulfonated HMOs. c, HPLC-MS analysis indicates the presence of HMOs with accurate masses (m/z) consistent with phosphorylated and sulfonated HMOs. HMOs i–vi and 3′SO3L have been identified previously in bovine milk; HMOs with m/z consistent with xiii–xv have been documented previously in pooled human milk (46). In all cases, the reducing-end residue was a hexose (i.e. glucose). Statistical differences between groups were assessed using a Mann–Whitney U test. *, p < 0.05; **, p < 0.01; n.d., not detected.

