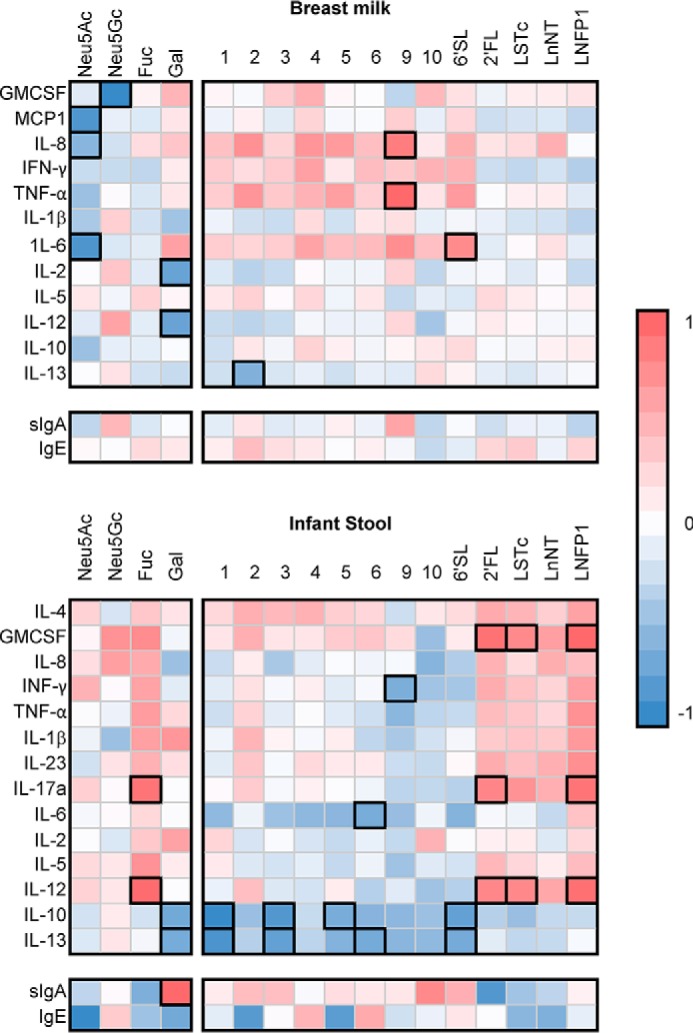
Figure 7.

The Spearman rank correlation heatmap for both Se+ and Se− samples (n = 16) depicts the associations between the levels of HMOs and oligosaccharides in human milk with immune markers in breast milk (top) and infant stool (bottom). Note that the intensity of each color indicates the directionality of the associations; all associations with p = < 0.05 are highlighted in black. HMOs are numbed as in Fig. 2.
