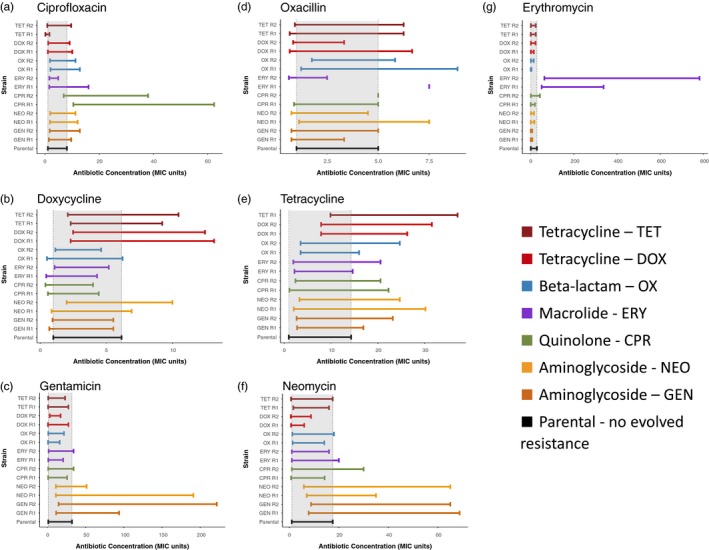
Figure 4.

The MSW tends to shift to the right and widen as resistance evolves. The gray regions indicate the mutant selection windows of the parental strain. The MSW for each spontaneous mutant‐resistant strain is shown in panels (a–g), which are divided by the antibiotic used to determine the MSW. As resistance evolves, the MSW tends to shift to the right and widen as compared to the parental strain (gray‐shaded region). When cross‐resistance does not evolve, the MSW is highly variable. In Panel (d), ERY R1 and CPR R2 have MSWs that appear as single points because the median MIC and median MPC for these strains are the same, so the MSW has a size of zero. Given the large antibiotic concentration increments used in this study, it is very likely that the true values lie in between the increments. In Panel (e), the TET R2 MSW is missing because the MIC and MPC for tetracycline of the TET R2 were undetermined due to high levels of resistance
