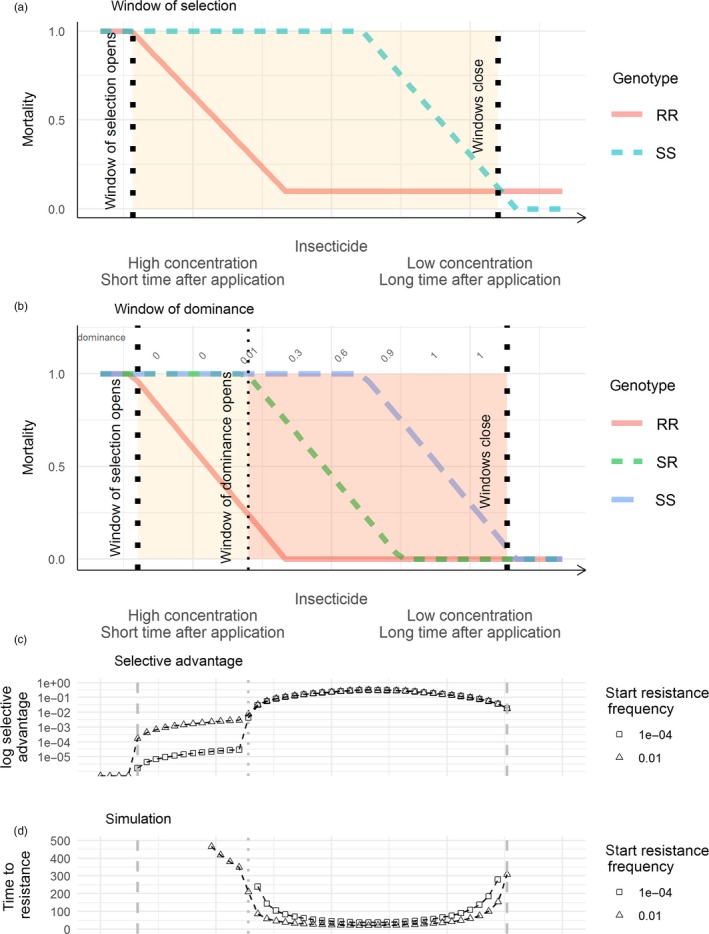
Figure 1.

Idealized windows of selection and windows of dominance for insecticide resistance. (a) Window of selection when there are only data on resistant and susceptible strains: selection for resistance occurs when resistant strains have lower mortality than susceptible ones (yellow shaded region). Fitness costs of resistance may cause the mortality of resistant insects to exceed that of susceptible ones at low concentrations, as shown at the lower right, and resistance will be selected against. (b–d) Idealized windows of selection and dominance when resistance is encoded by a single gene, and there are data on mortalities for all three genotypes (SS, SR and RR). The x‐axis is shared between (b–d). (b) illustrates how the mortality probabilities change for each genotype, and the row of numbers along the top of the plot is the dominance of resistance at each time point. (c) shows selective advantage per generation which is highest within the window of dominance. (d) shows predicted time until resistance allele frequency reaches 50% for simulations started at each point along the x‐axis in (b). Times to the 50% resistance threshold are lowest within the window of dominance, and the threshold of 500 generations is not reached for points outside of the window of selection. (c,d) assume that 30% of all mosquitoes are exposed to the insecticide, equivalent plots at different exposure levels are shown in the Appendix S1–S5
