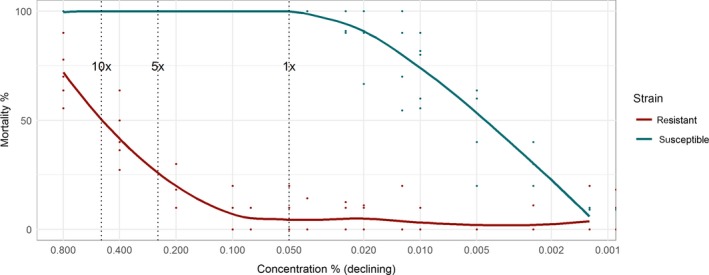
Figure 2.

Window of selection in units of insecticide concentration for Anopheles gambiae exposed to deltamethrin. Points show the percentage mortality 24 hr after exposure, by replicate, for resistant and susceptible strains, and lines show a locally weighted smoother (loess). The x‐axis is plotted from high to low concentrations, for consistency with time plots because concentrations decline with time after deployment. Vertical dashed lines indicate the WHO standard discriminating concentrations at 1×, 5× and 10× used to estimate resistance intensity (WHO, 2013a)
