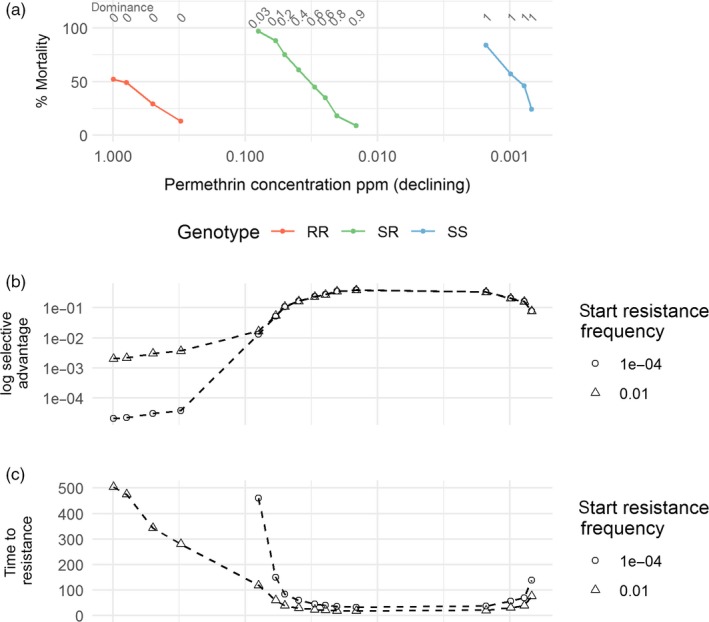
Figure 6.

Windows of selection and dominance, in units of concentration, associated with permethrin resistance in Culex quinquefasciatus. (a) shows data reported in Georghiou and Taylor (1986) from larvae exposed to the insecticide. The row of numbers along the top of (a) is our calculation of dominance of resistance for each concentration. (b and c) show our measures of selection calculated on the same concentration x‐axis. Where mortality data were absent, we extrapolated to 0 or 100% to extract values for the calculation (e.g. mortality of RR was assumed to be 0 at concentrations <0.1 ppm, and mortality of SS was assumed to be 100% at concentrations >0.01ppm). (b) shows how selective advantage changes during the windows of selection and how it depends on the starting frequency of resistance. (c) shows simulation results of the number of generations needed to reach a resistance allele frequency of 50%
