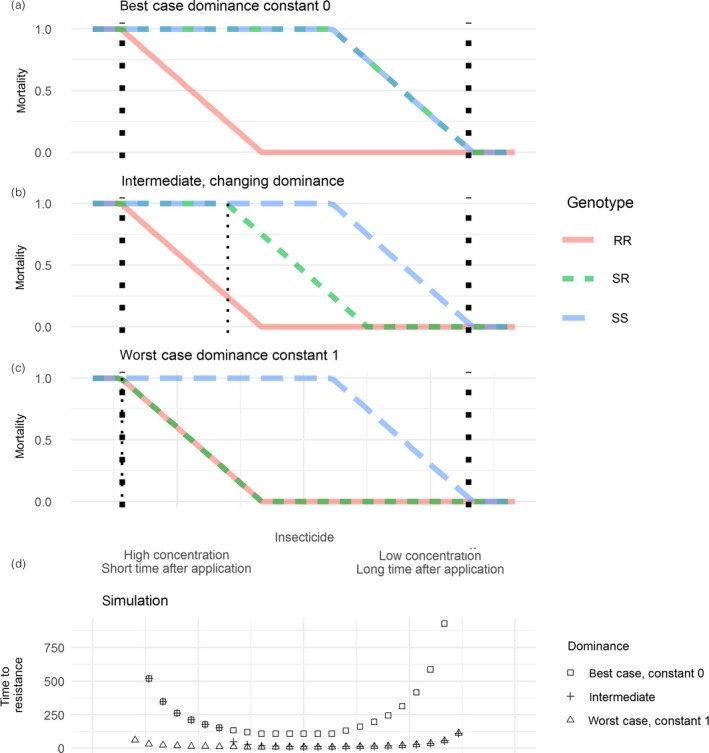
Figure 7.

Implications for selection of not knowing dominance values. (a–c) show three scenarios for a window of selection. (a) a best case where dominance is constant 0, mortality of the SR is the same as the SS, and there is no window of dominance. (b) an intermediate scenario the same as Figure 1b. (c) a worst‐case scenario where dominance is a constant 1, and the window of dominance is open for the whole of the window of selection. The x‐axis is shared between a–d. (d) shows predicted time until resistance allele frequency reaches 50% for simulations started at each point along the x‐axis in panels a–c. The difference between the best‐ and worst‐case scenarios can be hundreds of generations
