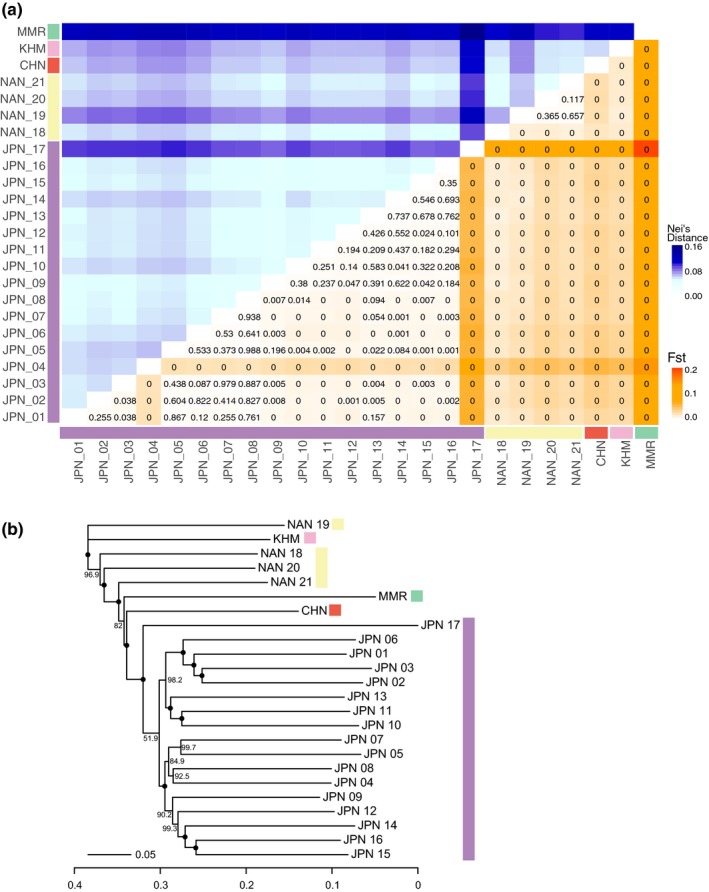
Figure 3.

Genetic distances among populations. (a) Pairwise genetic distances (Nei's distance in upper left and FST in lower right) among sample localities. For all pairwise FST, q‐values (FDR adjusted p‐values) are show in the tiles. (b) Neighbor‐joining tree based on Nei's distances. Bootstrap values are indicated at the nodes. Black circles indicate 100% bootstrap support
