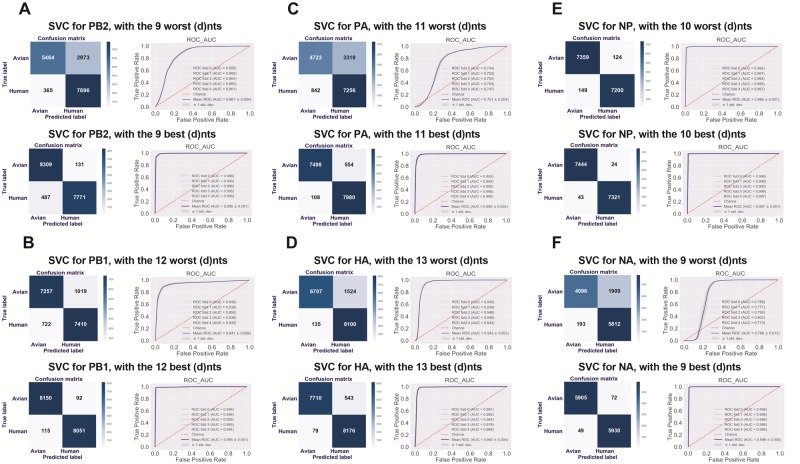
FIg. 5.
The prediction of human adaptation classes (true/false) and the human adaptation probability by the SVC model, with optimized (d)nts for each segment. The human adaptation classes (true/false) and the human adaptation probability of avian and human sequences were predicted by the SVC with the optimized (best) 9–13 (d)nts for the six segments, with the same optimized-(d)nt number tail (worst) (d)nts as the control. The confusion matrix for human adaptation class prediction, the ROC curve and the area under the ROC curve (AUC) for the SVC model with the worst or best (d)nts are indicated, respectively, for PB2 (A), PB1 (B), PA (C), HA (D), NP (E), and NA (F).

