Figure 3.

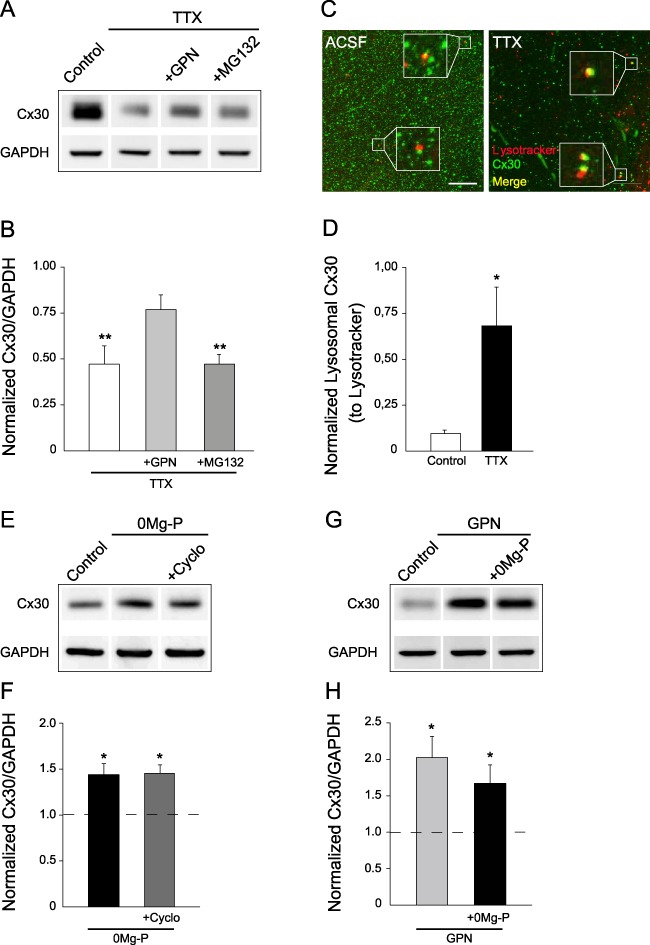
Neuronal activity controls Cx30 protein levels through lysosomal degradation. (A) Immunoblot detection of Cx30 expression in hippocampal acute slices incubated in TTX (0.5 μM, 1 h) with or without inhibitors of the lysosomal (GPN, 200 μM) or proteasomal (MG132, 10 μM) degradation pathways. GAPDH was used as a loading control. (B) Quantitative analysis of Cx30 expression showing that Cx30 levels were restored to control level by lysosomal inhibition (GPN, n = 5) but not by proteasomal inhibition (MG132, n = 5), thereby blocking the effects of action potential inhibition by TTX. Relative expression levels of Cx30 normalized to GAPDH levels; control ratio is set to 1. (C) Immunofluorescent staining of Cx30 (green) associated with LysoTracker labeling (red) in hippocampal CA1 region from acute slices incubated in ACSF or TTX (0.5 μM) for 1 h. Merge images show a net enrichment of Cx30 staining within lysosomes (yellow puncta) in TTX condition. Zooms are shown in white boxes for selected regions of interest highlighting LysoTracker-stained lysosomes contacting Cx30 aggregates. Scale bar, 25 μm. (D) Quantitative analysis of Cx30 intensity within lysosomes. Relative intensity levels of Cx30 staining within LysoTracker particles normalized to LysoTracker staining intensity in control (n = 9) and TTX (n = 9) conditions. (E) Immunoblot detection of Cx30 expression in hippocampal acute slices incubated in 0Mg-P (100 μM, 3 h) with or without cycloheximide, a protein synthesis inhibitor (Cyclo, 400 μM). GAPDH was used as a loading control. (F) Quantitative analysis of Cx30 expression. Relative expression levels of Cx30 normalized to GAPDH levels showing that the activity-dependent upregulation of Cx30 expression (0Mg-P, n = 3) was not blocked by inhibition of protein synthesis (Cyclo, n = 3); control ratio is set to 1. (G) Immunoblot detection of Cx30 expression in hippocampal acute slices incubated with a lysosomal inhibitor (GPN, 200 μM, 3 h) with or without 0Mg-P (100 μM). GAPDH was used as a loading control. (H) Quantitative analysis of Cx30 expression. Relative expression levels of Cx30 normalized to GAPDH levels, showing that blocking lysosomal degradation in control conditions (GPN, n = 5) increased by itself Cx30 expression, and to a similar extent as 0Mg-P. In addition, bursting activity did not further increase Cx30 levels (GPN + 0Mg-P, n = 8); control ratio is set to 1 (n = 3). Asterisks indicate statistical significance (*P < 0.05, **P < 0.01).
