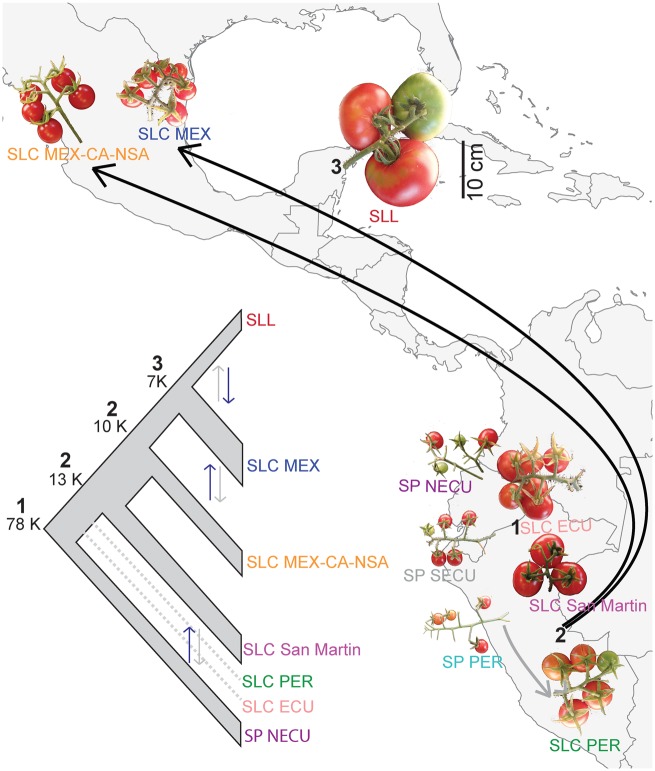
FIg. 3.
Inferred tomato phylogeny and domestication history based on the combined results of population history analyses and comparisons of median fruit size. Estimates of divergence times and changes in population sizes using ∂a∂i are provided for the major events in tomato domestication history (left panel): origin of SLC (1), northward spreads of SLC (2), and redomestication of SLL (3). Asymmetric gene flow between groups is shown by double arrows with black arrow representing stronger gene flow in that direction. Width of the branches on the summary tree represents population expansion or contraction. Dotted lines represent populations included only in the models examining the origin of SLC (1). In the right panel, a transition to wild-like fruit sizes is evident in the northernmost populations of SLC (SLC MEX and SLC MEX-CA-NSA). A scale bar (=10 cm) applicable to all fruit images is provided. Black arrows represent northward spreads of SLC. Gray arrow represents gene flow between SP PER and SLC PER.

