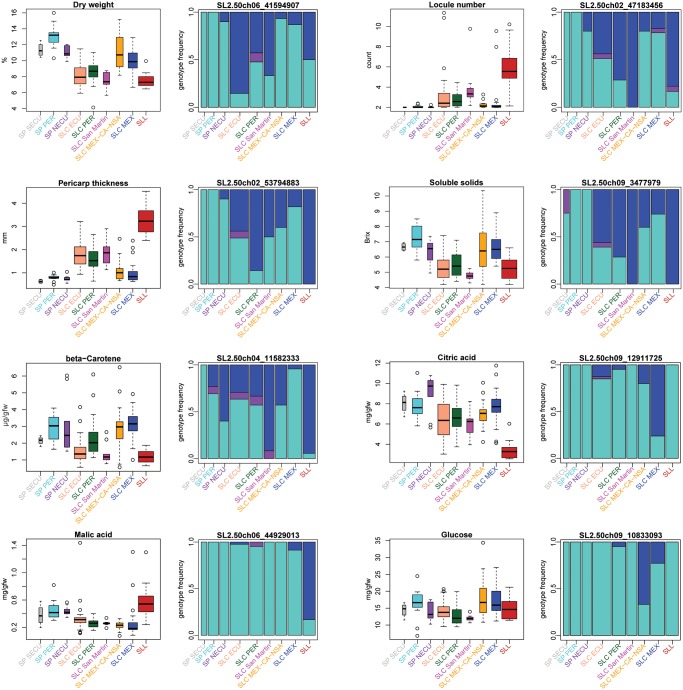
FIg. 4.
Phenotypic and genotypic changes of eight agriculturally important fruit traits (a–h) through tomato domestication history. For each trait, the phenotypic distribution (left) and the genotype frequencies of the most significantly correlated SNP from GWAS (right) are presented. In the genotype frequency plots, alleles frequent in SP were considered as ancestral homozygous genotypes for these and are shown in turquoise; homozygotes for derived alleles are shown in blue. The frequency of heterozygotes is shown in purple. Bar widths are proportionate to the sample size of each population. An N- (or И-) shaped trend (see Results) is evident in many of the phenotypes presented.

