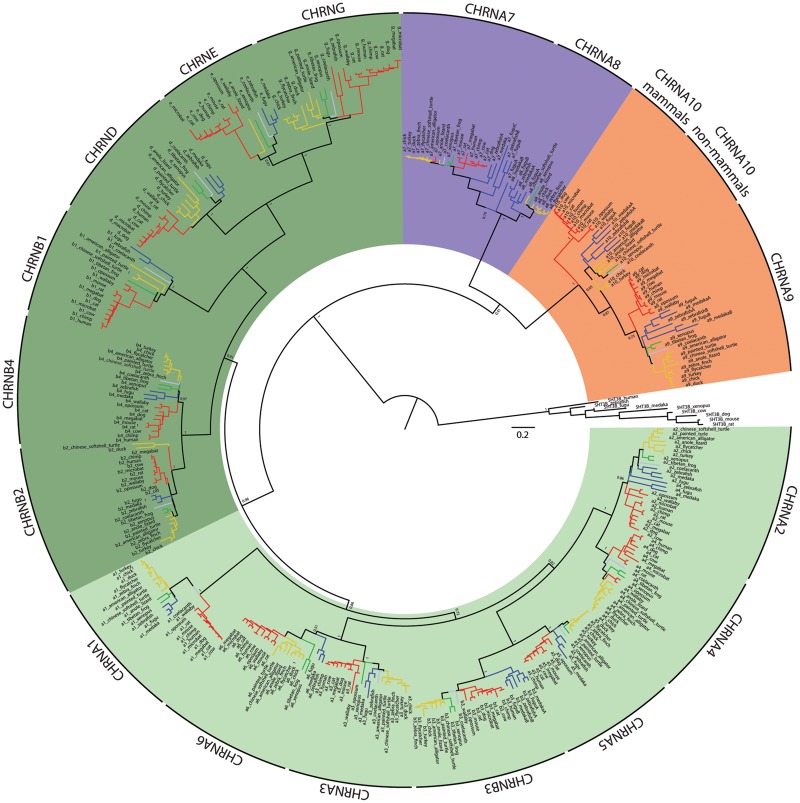
FIg. 1.
Phylogenetic tree of vertebrate nAChR subunits. Complete minimum evolution phylogenetic tree corresponding to the collapsed tree shown in figure 2A, obtained with variation rates among sites modeled by a gamma distribution. Red branches, mammals; yellow branches, sauropsids; green branches, amphibians; blue branches, fish; light blue branches, coelacanth. Shadings denote the different groups of subunits: light greens, α subunits; dark green, non-α subunits; purple, α7-like subunits; orange, α9-like subunits. The tree was built using minimum evolution method and pairwise deletion for missing sites. The optimal tree with a sum of branch length of 47.32565515 is shown. For clarity, the percentage of replicate trees in which the associated taxa clustered together in the bootstrap test (1,000 replicates) are shown only next to the branches that separate different subunits. The tree is drawn to scale, with branch lengths in the same units as those of the evolutionary distances used to infer the tree.

