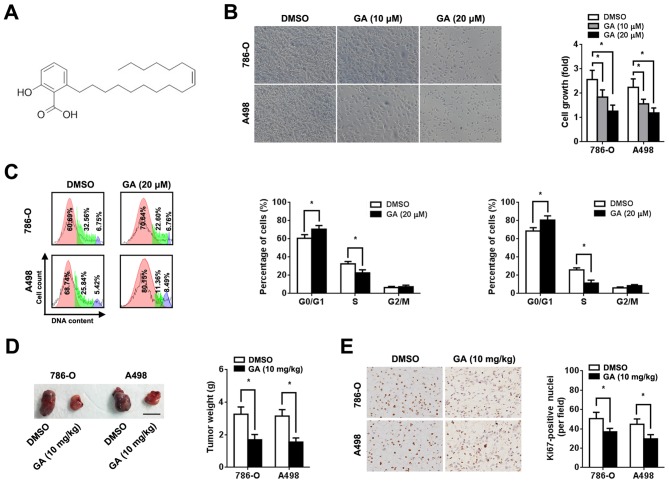
Figure 1.
Effect of GA on RCC cell proliferation. 786-O and A498 cells were pre-treated with or without 10 or 20 µM GA, as indicated. (A) Chemical structure of GA (C17:1; C24H38O3). (B) Representative images and quantification of cell viability (magnification, x200). Cell viability analysis was performed 72 h after treatment using an MTT assay. (C) Representative cell cycle plots and quantification 2 days after GA treatment (red, G0/G1 phase; green, S phase and purple, G0/M phase). Assessment of cell phase percentage was conducted using flow cytometry. (D) Representative images and quantification of subcutaneous xenograft tumors derived from mice in the GA and DMSO groups. Scale bar, 1 cm. Tumor weight was measured 6 weeks after injection. (E) Representative image and quantification of immunohistochemical staining for Ki-67 (magnification, x200). n=5. *P<0.05. GA, ginkgolic acid; RCC, renal cell carcinoma.

